German Russian vs Alaska Native Vision Disability
COMPARE
German Russian
Alaska Native
Vision Disability
Vision Disability Comparison
German Russians
Alaska Natives
2.3%
VISION DISABILITY
1.8/ 100
METRIC RATING
232nd/ 347
METRIC RANK
2.7%
VISION DISABILITY
0.0/ 100
METRIC RATING
318th/ 347
METRIC RANK
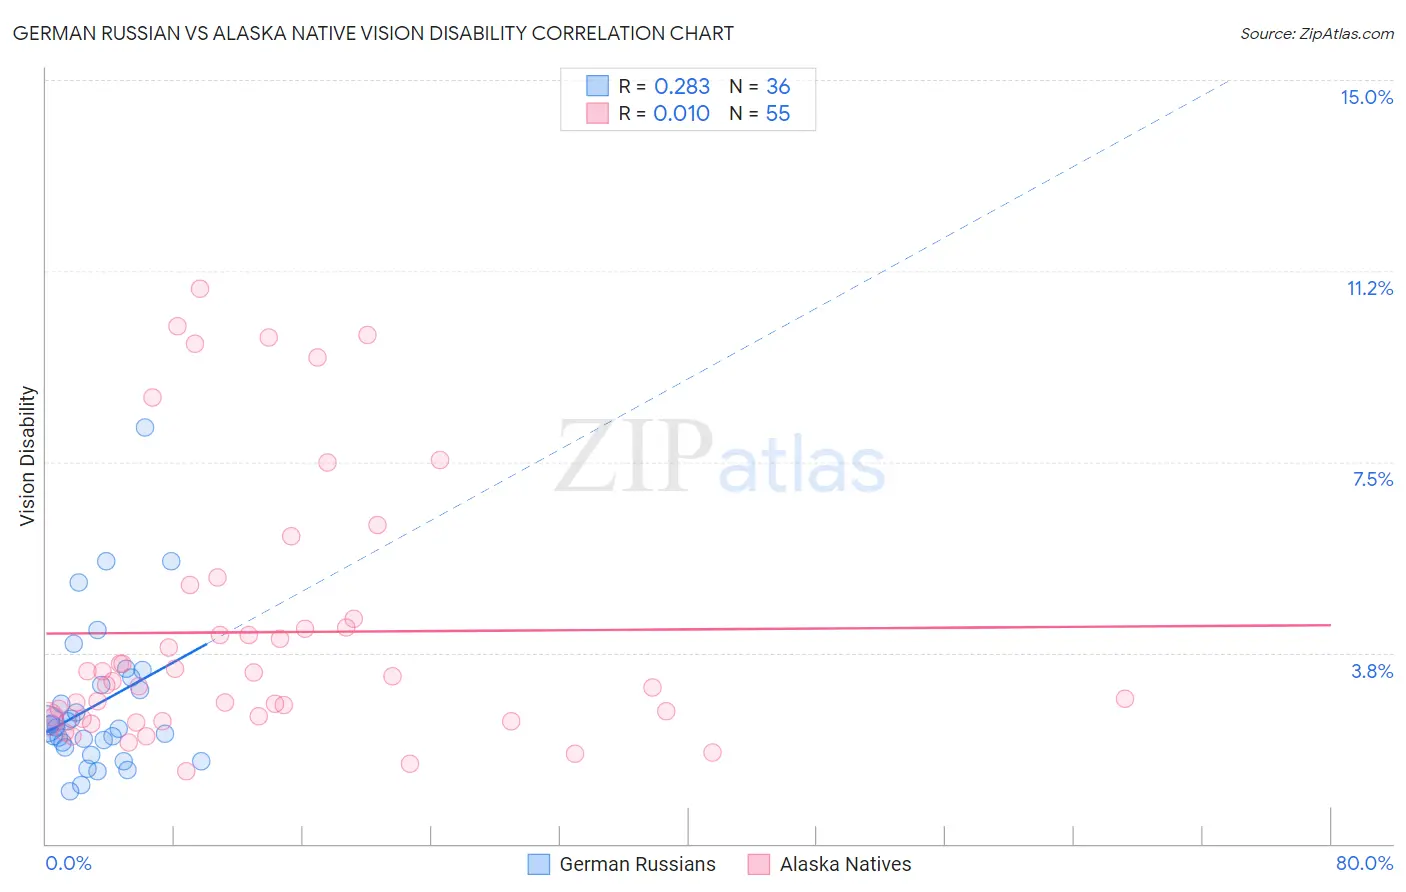
German Russian vs Alaska Native Vision Disability Correlation Chart
The statistical analysis conducted on geographies consisting of 96,448,558 people shows a weak positive correlation between the proportion of German Russians and percentage of population with vision disability in the United States with a correlation coefficient (R) of 0.283 and weighted average of 2.3%. Similarly, the statistical analysis conducted on geographies consisting of 76,749,466 people shows no correlation between the proportion of Alaska Natives and percentage of population with vision disability in the United States with a correlation coefficient (R) of 0.010 and weighted average of 2.7%, a difference of 18.5%.
Vision Disability Correlation Summary
| Measurement | German Russian | Alaska Native |
| Minimum | 1.0% | 1.4% |
| Maximum | 8.2% | 10.9% |
| Range | 7.1% | 9.5% |
| Mean | 2.7% | 4.2% |
| Median | 2.3% | 3.2% |
| Interquartile 25% (IQ1) | 1.9% | 2.5% |
| Interquartile 75% (IQ3) | 3.2% | 4.4% |
| Interquartile Range (IQR) | 1.2% | 1.9% |
| Standard Deviation (Sample) | 1.5% | 2.6% |
| Standard Deviation (Population) | 1.4% | 2.5% |
Similar Demographics by Vision Disability
Demographics Similar to German Russians by Vision Disability
In terms of vision disability, the demographic groups most similar to German Russians are Central American (2.3%, a difference of 0.020%), Immigrants from Ecuador (2.3%, a difference of 0.19%), Scottish (2.3%, a difference of 0.20%), Marshallese (2.3%, a difference of 0.27%), and Nicaraguan (2.3%, a difference of 0.35%).
| Demographics | Rating | Rank | Vision Disability |
| Immigrants | Western Africa | 3.4 /100 | #225 | Tragic 2.3% |
| Immigrants | Germany | 3.0 /100 | #226 | Tragic 2.3% |
| Hawaiians | 2.9 /100 | #227 | Tragic 2.3% |
| Hmong | 2.5 /100 | #228 | Tragic 2.3% |
| Welsh | 2.3 /100 | #229 | Tragic 2.3% |
| Nicaraguans | 2.2 /100 | #230 | Tragic 2.3% |
| Immigrants | Ecuador | 2.0 /100 | #231 | Tragic 2.3% |
| German Russians | 1.8 /100 | #232 | Tragic 2.3% |
| Central Americans | 1.8 /100 | #233 | Tragic 2.3% |
| Scottish | 1.6 /100 | #234 | Tragic 2.3% |
| Marshallese | 1.5 /100 | #235 | Tragic 2.3% |
| Immigrants | Congo | 1.4 /100 | #236 | Tragic 2.3% |
| Immigrants | Portugal | 1.4 /100 | #237 | Tragic 2.3% |
| Immigrants | Cambodia | 1.1 /100 | #238 | Tragic 2.3% |
| English | 1.1 /100 | #239 | Tragic 2.3% |
Demographics Similar to Alaska Natives by Vision Disability
In terms of vision disability, the demographic groups most similar to Alaska Natives are Yup'ik (2.7%, a difference of 1.1%), Shoshone (2.7%, a difference of 1.3%), Tohono O'odham (2.8%, a difference of 1.4%), Osage (2.7%, a difference of 1.8%), and Black/African American (2.8%, a difference of 2.1%).
| Demographics | Rating | Rank | Vision Disability |
| Dominicans | 0.0 /100 | #311 | Tragic 2.6% |
| Americans | 0.0 /100 | #312 | Tragic 2.6% |
| Potawatomi | 0.0 /100 | #313 | Tragic 2.6% |
| Inupiat | 0.0 /100 | #314 | Tragic 2.7% |
| Osage | 0.0 /100 | #315 | Tragic 2.7% |
| Shoshone | 0.0 /100 | #316 | Tragic 2.7% |
| Yup'ik | 0.0 /100 | #317 | Tragic 2.7% |
| Alaska Natives | 0.0 /100 | #318 | Tragic 2.7% |
| Tohono O'odham | 0.0 /100 | #319 | Tragic 2.8% |
| Blacks/African Americans | 0.0 /100 | #320 | Tragic 2.8% |
| Comanche | 0.0 /100 | #321 | Tragic 2.8% |
| Paiute | 0.0 /100 | #322 | Tragic 2.9% |
| Tlingit-Haida | 0.0 /100 | #323 | Tragic 2.9% |
| Hopi | 0.0 /100 | #324 | Tragic 2.9% |
| Cherokee | 0.0 /100 | #325 | Tragic 2.9% |