European vs Immigrants from Liberia Disability Age 65 to 74
COMPARE
European
Immigrants from Liberia
Disability Age 65 to 74
Disability Age 65 to 74 Comparison
Europeans
Immigrants from Liberia
23.2%
DISABILITY AGE 65 TO 74
61.2/ 100
METRIC RATING
162nd/ 347
METRIC RANK
25.7%
DISABILITY AGE 65 TO 74
0.1/ 100
METRIC RATING
271st/ 347
METRIC RANK
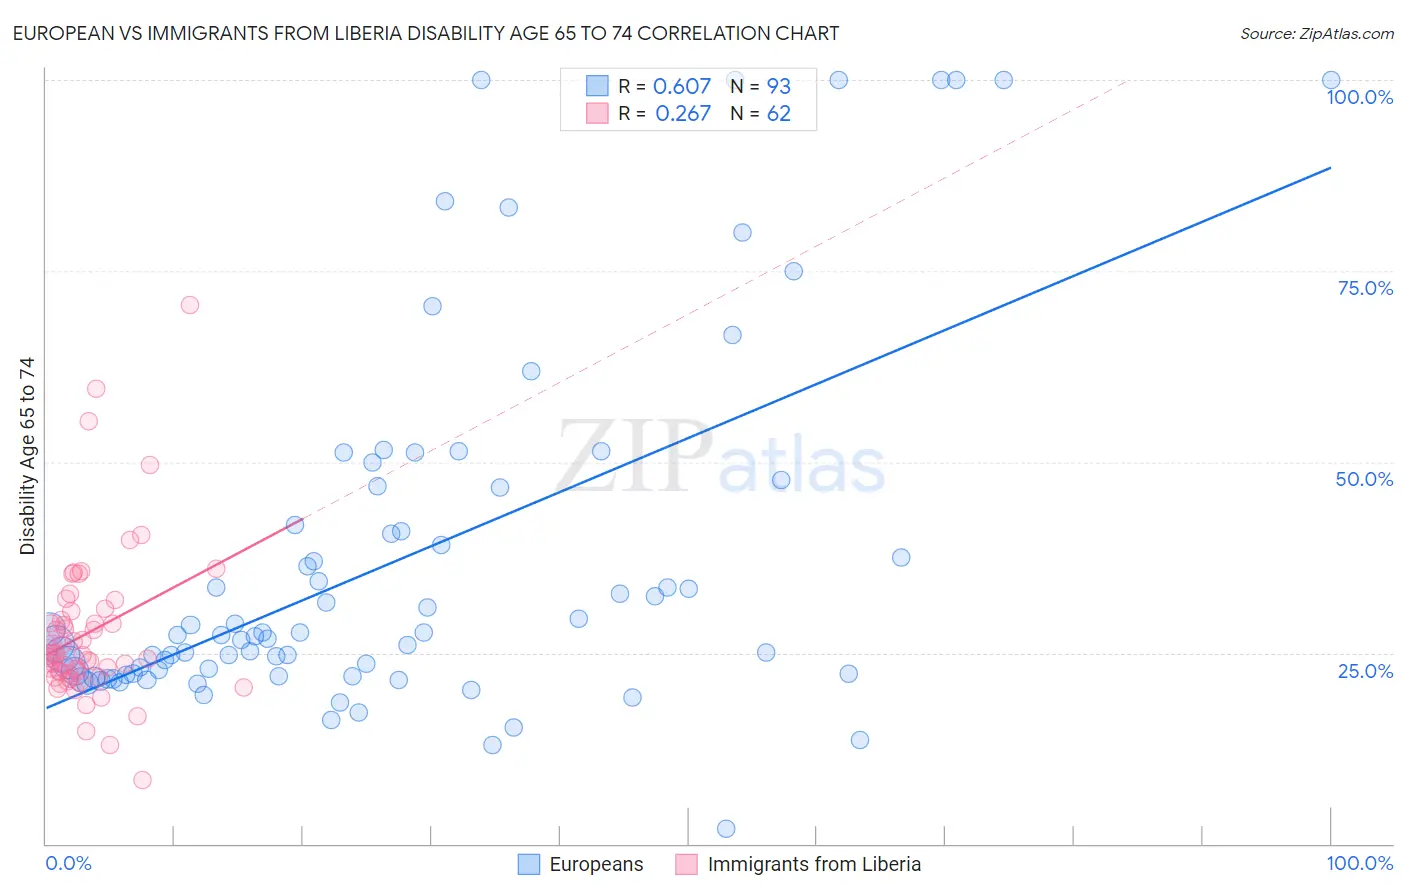
European vs Immigrants from Liberia Disability Age 65 to 74 Correlation Chart
The statistical analysis conducted on geographies consisting of 559,638,797 people shows a significant positive correlation between the proportion of Europeans and percentage of population with a disability between the ages 65 and 75 in the United States with a correlation coefficient (R) of 0.607 and weighted average of 23.2%. Similarly, the statistical analysis conducted on geographies consisting of 135,108,092 people shows a weak positive correlation between the proportion of Immigrants from Liberia and percentage of population with a disability between the ages 65 and 75 in the United States with a correlation coefficient (R) of 0.267 and weighted average of 25.7%, a difference of 10.8%.
Disability Age 65 to 74 Correlation Summary
| Measurement | European | Immigrants from Liberia |
| Minimum | 2.0% | 8.3% |
| Maximum | 100.0% | 70.5% |
| Range | 98.0% | 62.1% |
| Mean | 37.1% | 27.6% |
| Median | 27.4% | 24.7% |
| Interquartile 25% (IQ1) | 22.2% | 22.2% |
| Interquartile 75% (IQ3) | 44.2% | 30.4% |
| Interquartile Range (IQR) | 22.0% | 8.2% |
| Standard Deviation (Sample) | 23.8% | 10.4% |
| Standard Deviation (Population) | 23.7% | 10.3% |
Similar Demographics by Disability Age 65 to 74
Demographics Similar to Europeans by Disability Age 65 to 74
In terms of disability age 65 to 74, the demographic groups most similar to Europeans are Immigrants from Philippines (23.2%, a difference of 0.0%), Sierra Leonean (23.2%, a difference of 0.020%), Vietnamese (23.2%, a difference of 0.030%), Immigrants from Afghanistan (23.2%, a difference of 0.040%), and Immigrants from Cameroon (23.1%, a difference of 0.16%).
| Demographics | Rating | Rank | Disability Age 65 to 74 |
| British | 73.9 /100 | #155 | Good 23.0% |
| Immigrants | Western Asia | 73.8 /100 | #156 | Good 23.0% |
| Czechoslovakians | 72.4 /100 | #157 | Good 23.0% |
| Immigrants | Vietnam | 69.1 /100 | #158 | Good 23.1% |
| South American Indians | 65.5 /100 | #159 | Good 23.1% |
| Koreans | 64.2 /100 | #160 | Good 23.1% |
| Immigrants | Cameroon | 63.8 /100 | #161 | Good 23.1% |
| Europeans | 61.2 /100 | #162 | Good 23.2% |
| Immigrants | Philippines | 61.1 /100 | #163 | Good 23.2% |
| Sierra Leoneans | 60.9 /100 | #164 | Good 23.2% |
| Vietnamese | 60.8 /100 | #165 | Good 23.2% |
| Immigrants | Afghanistan | 60.5 /100 | #166 | Good 23.2% |
| Immigrants | Bosnia and Herzegovina | 57.6 /100 | #167 | Average 23.2% |
| Pakistanis | 57.0 /100 | #168 | Average 23.2% |
| Icelanders | 54.3 /100 | #169 | Average 23.3% |
Demographics Similar to Immigrants from Liberia by Disability Age 65 to 74
In terms of disability age 65 to 74, the demographic groups most similar to Immigrants from Liberia are Immigrants from Dominica (25.7%, a difference of 0.0%), Immigrants from Guatemala (25.7%, a difference of 0.030%), Hmong (25.7%, a difference of 0.11%), Japanese (25.7%, a difference of 0.13%), and Liberian (25.6%, a difference of 0.23%).
| Demographics | Rating | Rank | Disability Age 65 to 74 |
| Hawaiians | 0.2 /100 | #264 | Tragic 25.5% |
| Guatemalans | 0.2 /100 | #265 | Tragic 25.5% |
| Immigrants | Latin America | 0.1 /100 | #266 | Tragic 25.6% |
| Ottawa | 0.1 /100 | #267 | Tragic 25.6% |
| Liberians | 0.1 /100 | #268 | Tragic 25.6% |
| Hmong | 0.1 /100 | #269 | Tragic 25.7% |
| Immigrants | Guatemala | 0.1 /100 | #270 | Tragic 25.7% |
| Immigrants | Liberia | 0.1 /100 | #271 | Tragic 25.7% |
| Immigrants | Dominica | 0.1 /100 | #272 | Tragic 25.7% |
| Japanese | 0.1 /100 | #273 | Tragic 25.7% |
| Americans | 0.1 /100 | #274 | Tragic 25.8% |
| Hondurans | 0.1 /100 | #275 | Tragic 25.8% |
| French American Indians | 0.1 /100 | #276 | Tragic 25.8% |
| Belizeans | 0.1 /100 | #277 | Tragic 25.8% |
| Immigrants | Belize | 0.1 /100 | #278 | Tragic 25.8% |