European vs Immigrants from Liberia Associate's Degree

COMPARE

European
Race
Ancestry
AfghanAfricanAlaska NativeAlaskan AthabascanAlbanianAleutAlsatianAmericanApacheArabArapahoArgentineanArmenianAssyrian/Chaldean/SyriacAustralianAustrianBahamianBangladeshiBarbadianBasqueBelgianBelizeanBermudanBhutaneseBlackfeetBolivianBrazilianBritishBritish West IndianBulgarianBurmeseCajunCambodianCanadianCape VerdeanCarpatho RusynCelticCentral AmericanCentral American IndianCherokeeCheyenneChickasawChileanChineseChippewaChoctawColombianColvilleComancheCosta RicanCreeCreekCroatianCrowCubanCypriotCzechCzechoslovakianDanishDelawareDominicanDutchDutch West IndianEastern EuropeanEcuadorianEgyptianEnglishEstonianEthiopianEuropeanFijianFilipinoFinnishFrenchFrench American IndianFrench CanadianGermanGerman RussianGhanaianGreekGuamanian/ChamorroGuatemalanGuyaneseHaitianHmongHonduranHopiHoumaHungarianIcelanderIndian (Asian)IndonesianInupiatIranianIraqiIrishIroquoisIsraeliItalianJamaicanJapaneseJordanianKenyanKiowaKoreanLaotianLatvianLebaneseLiberianLithuanianLumbeeLuxembourgerMacedonianMalaysianMalteseMarshalleseMenomineeMexicanMexican American IndianMongolianMoroccanNative HawaiianNavajoNepaleseNew ZealanderNicaraguanNigerianNorthern EuropeanNorwegianOkinawanOsageOttawaPaiutePakistaniPalestinianPanamanianParaguayanPennsylvania GermanPeruvianPimaPolishPortuguesePotawatomiPuebloPuerto RicanPuget Sound SalishRomanianRussianSalvadoranSamoanScandinavianScotch-IrishScottishSeminoleSenegaleseSerbianShoshoneSierra LeoneanSiouxSlavicSlovakSloveneSomaliSouth AfricanSouth AmericanSouth American IndianSoviet UnionSpaniardSpanishSpanish AmericanSpanish American IndianSri LankanSubsaharan AfricanSudaneseSwedishSwissSyrianTaiwaneseThaiTlingit-HaidaTohono O'OdhamTonganTrinidadian and TobagonianTsimshianTurkishU.S. Virgin IslanderUgandanUkrainianUruguayanUteVenezuelanVietnameseWelshWest IndianYakamaYaquiYugoslavianYumanYup'ikZimbabwean
Immigration
NonimmigrantsImmigrantsAfghanistanAfricaAlbaniaArgentinaArmeniaAsiaAustraliaAustriaBahamasBangladeshBarbadosBelarusBelgiumBelizeBoliviaBosnia and HerzegovinaBrazilBulgariaBurma/MyanmarCabo VerdeCambodiaCameroonCanadaCaribbeanCentral AmericaChileChinaColombiaCongoCosta RicaCroatiaCubaCzechoslovakiaDenmarkDominicaDominican RepublicEastern AfricaEastern AsiaEastern EuropeEcuadorEgyptEl SalvadorEnglandEritreaEthiopiaEuropeFijiFranceGermanyGhanaGreeceGrenadaGuatemalaGuyanaHaitiHondurasHong KongHungaryIndiaIndonesiaIranIraqIrelandIsraelItalyJamaicaJapanJordanKazakhstanKenyaKoreaKuwaitLaosLatin AmericaLatviaLebanonLithuaniaMalaysiaMexicoMicronesiaMiddle AfricaMoldovaMoroccoNepalNetherlandsNicaraguaNigeriaNorth AmericaNorth MacedoniaNorthern AfricaNorthern EuropeNorwayOceaniaPakistanPanamaPeruPhilippinesPolandPortugalRomaniaRussiaSaudi ArabiaScotlandSenegalSerbiaSierra LeoneSingaporeSomaliaSouth AfricaSouth AmericaSouth Central AsiaSouth Eastern AsiaSouthern EuropeSpainSri LankaSt. Vincent and the GrenadinesSudanSwedenSwitzerlandSyriaTaiwanThailandTrinidad and TobagoTurkeyUgandaUkraineUruguayUzbekistanVenezuelaVietnamWest IndiesWestern AfricaWestern AsiaWestern EuropeYemenZaireZimbabweAzores
Immigrants from Liberia
Race
Ancestry
AfghanAfricanAlaska NativeAlaskan AthabascanAlbanianAleutAlsatianAmericanApacheArabArapahoArgentineanArmenianAssyrian/Chaldean/SyriacAustralianAustrianBahamianBangladeshiBarbadianBasqueBelgianBelizeanBermudanBhutaneseBlackfeetBolivianBrazilianBritishBritish West IndianBulgarianBurmeseCajunCambodianCanadianCape VerdeanCarpatho RusynCelticCentral AmericanCentral American IndianCherokeeCheyenneChickasawChileanChineseChippewaChoctawColombianColvilleComancheCosta RicanCreeCreekCroatianCrowCubanCypriotCzechCzechoslovakianDanishDelawareDominicanDutchDutch West IndianEastern EuropeanEcuadorianEgyptianEnglishEstonianEthiopianFijianFilipinoFinnishFrenchFrench American IndianFrench CanadianGermanGerman RussianGhanaianGreekGuamanian/ChamorroGuatemalanGuyaneseHaitianHmongHonduranHopiHoumaHungarianIcelanderIndian (Asian)IndonesianInupiatIranianIraqiIrishIroquoisIsraeliItalianJamaicanJapaneseJordanianKenyanKiowaKoreanLaotianLatvianLebaneseLiberianLithuanianLumbeeLuxembourgerMacedonianMalaysianMalteseMarshalleseMenomineeMexicanMexican American IndianMongolianMoroccanNative HawaiianNavajoNepaleseNew ZealanderNicaraguanNigerianNorthern EuropeanNorwegianOkinawanOsageOttawaPaiutePakistaniPalestinianPanamanianParaguayanPennsylvania GermanPeruvianPimaPolishPortuguesePotawatomiPuebloPuerto RicanPuget Sound SalishRomanianRussianSalvadoranSamoanScandinavianScotch-IrishScottishSeminoleSenegaleseSerbianShoshoneSierra LeoneanSiouxSlavicSlovakSloveneSomaliSouth AfricanSouth AmericanSouth American IndianSoviet UnionSpaniardSpanishSpanish AmericanSpanish American IndianSri LankanSubsaharan AfricanSudaneseSwedishSwissSyrianTaiwaneseThaiTlingit-HaidaTohono O'OdhamTonganTrinidadian and TobagonianTsimshianTurkishU.S. Virgin IslanderUgandanUkrainianUruguayanUteVenezuelanVietnameseWelshWest IndianYakamaYaquiYugoslavianYumanYup'ikZimbabwean
Immigration
NonimmigrantsImmigrantsAfghanistanAfricaAlbaniaArgentinaArmeniaAsiaAustraliaAustriaBahamasBangladeshBarbadosBelarusBelgiumBelizeBoliviaBosnia and HerzegovinaBrazilBulgariaBurma/MyanmarCabo VerdeCambodiaCameroonCanadaCaribbeanCentral AmericaChileChinaColombiaCongoCosta RicaCroatiaCubaCzechoslovakiaDenmarkDominicaDominican RepublicEastern AfricaEastern AsiaEastern EuropeEcuadorEgyptEl SalvadorEnglandEritreaEthiopiaEuropeFijiFranceGermanyGhanaGreeceGrenadaGuatemalaGuyanaHaitiHondurasHong KongHungaryIndiaIndonesiaIranIraqIrelandIsraelItalyJamaicaJapanJordanKazakhstanKenyaKoreaKuwaitLaosLatin AmericaLatviaLebanonLiberiaLithuaniaMalaysiaMexicoMicronesiaMiddle AfricaMoldovaMoroccoNepalNetherlandsNicaraguaNigeriaNorth AmericaNorth MacedoniaNorthern AfricaNorthern EuropeNorwayOceaniaPakistanPanamaPeruPhilippinesPolandPortugalRomaniaRussiaSaudi ArabiaScotlandSenegalSerbiaSierra LeoneSingaporeSomaliaSouth AfricaSouth AmericaSouth Central AsiaSouth Eastern AsiaSouthern EuropeSpainSri LankaSt. Vincent and the GrenadinesSudanSwedenSwitzerlandSyriaTaiwanThailandTrinidad and TobagoTurkeyUgandaUkraineUruguayUzbekistanVenezuelaVietnamWest IndiesWestern AfricaWestern AsiaWestern EuropeYemenZaireZimbabweAzores
Associate's Degree
Income
Poverty
Unemployment
Labor Participation
Family Structure
Vehicle Availability
Education Level
Disability

Associate's Degree Comparison

Europeans

Immigrants from Liberia

Excellent
Tragic
48.2%
ASSOCIATE'S DEGREE
89.0/ 100
METRIC RATING
135th/ 347
METRIC RANK
42.3%
ASSOCIATE'S DEGREE
0.9/ 100
METRIC RATING
244th/ 347
METRIC RANK

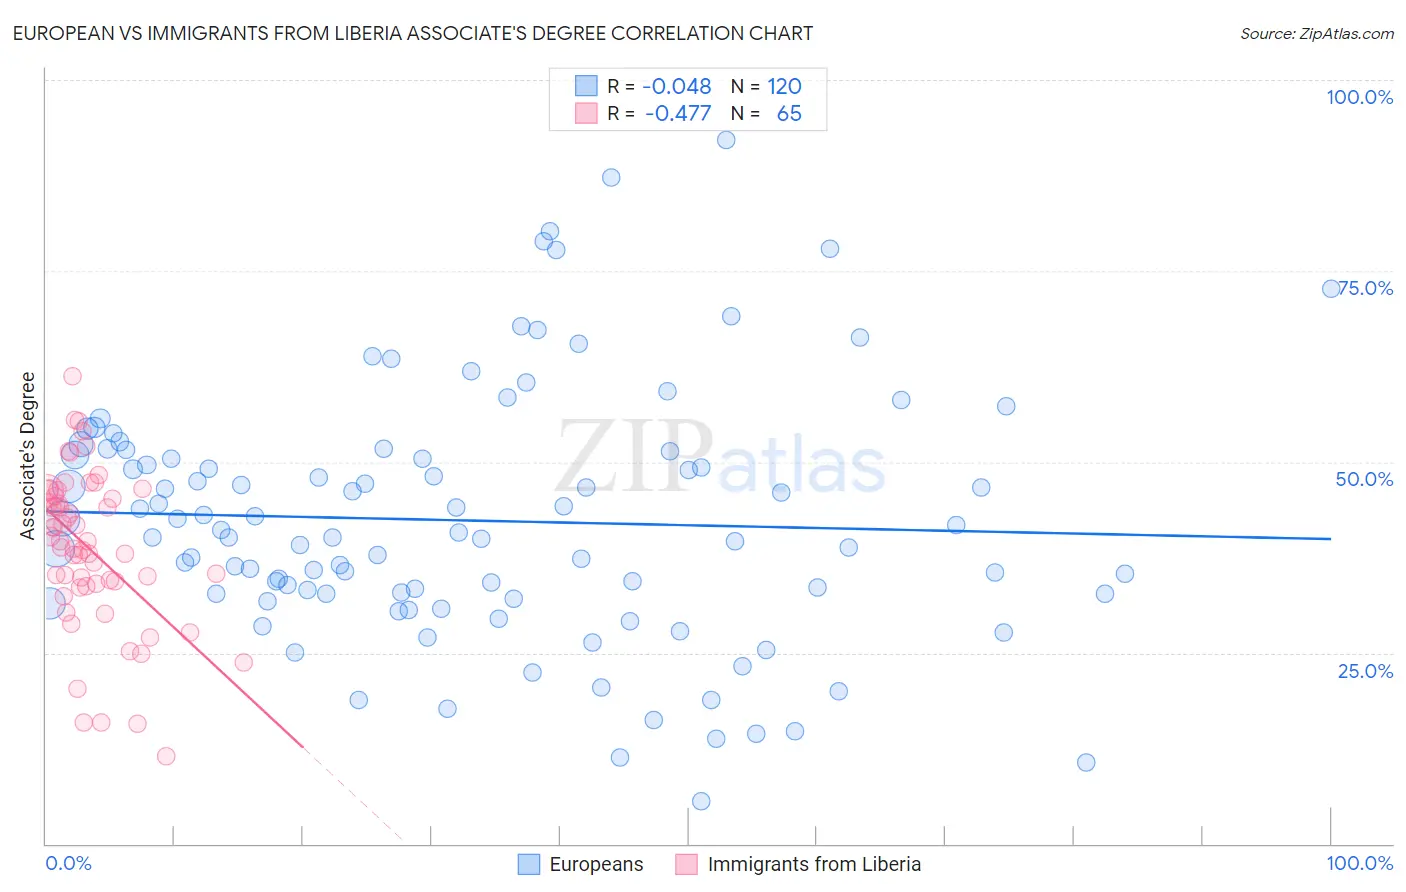
European vs Immigrants from Liberia Associate's Degree Correlation Chart

The statistical analysis conducted on geographies consisting of 561,753,260 people shows no correlation between the proportion of Europeans and percentage of population with at least associate's degree education in the United States with a correlation coefficient (R) of -0.048 and weighted average of 48.2%. Similarly, the statistical analysis conducted on geographies consisting of 135,295,697 people shows a moderate negative correlation between the proportion of Immigrants from Liberia and percentage of population with at least associate's degree education in the United States with a correlation coefficient (R) of -0.477 and weighted average of 42.3%, a difference of 13.9%.
European vs Immigrants from Liberia Associate's Degree

Associate's Degree Correlation Summary

MeasurementEuropeanImmigrants from Liberia
Minimum5.6%11.5%
Maximum92.2%61.3%
Range86.6%49.8%
Mean42.3%38.6%
Median40.4%39.5%
Interquartile 25% (IQ1)32.7%33.9%
Interquartile 75% (IQ3)51.2%45.8%
Interquartile Range (IQR)18.5%12.0%
Standard Deviation (Sample)16.5%10.2%
Standard Deviation (Population)16.4%10.2%

Similar Demographics by Associate's Degree

Demographics Similar to Europeans by Associate's Degree

In terms of associate's degree, the demographic groups most similar to Europeans are Moroccan (48.2%, a difference of 0.060%), Assyrian/Chaldean/Syriac (48.2%, a difference of 0.080%), Immigrants from Albania (48.2%, a difference of 0.16%), Pakistani (48.1%, a difference of 0.18%), and Immigrants from Eritrea (48.1%, a difference of 0.22%).
DemographicsRating | RankAssociate's Degree
Immigrants | Eastern Africa
91.6
/100
|
#128
Exceptional
48.4%
Swedes
91.5
/100
|
#129
Exceptional
48.4%
Immigrants | Jordan
91.2
/100
|
#130
Exceptional
48.4%
Icelanders
90.8
/100
|
#131
Exceptional
48.3%
Immigrants | Albania
89.9
/100
|
#132
Excellent
48.2%
Assyrians/Chaldeans/Syriacs
89.4
/100
|
#133
Excellent
48.2%
Moroccans
89.3
/100
|
#134
Excellent
48.2%
Europeans
89.0
/100
|
#135
Excellent
48.2%
Pakistanis
88.0
/100
|
#136
Excellent
48.1%
Immigrants | Eritrea
87.8
/100
|
#137
Excellent
48.1%
Poles
87.3
/100
|
#138
Excellent
48.0%
Slovenes
85.1
/100
|
#139
Excellent
47.9%
Immigrants | Southern Europe
84.4
/100
|
#140
Excellent
47.8%
Taiwanese
83.3
/100
|
#141
Excellent
47.7%
Sierra Leoneans
82.9
/100
|
#142
Excellent
47.7%

Demographics Similar to Immigrants from Liberia by Associate's Degree

In terms of associate's degree, the demographic groups most similar to Immigrants from Liberia are Immigrants from Cambodia (42.3%, a difference of 0.020%), Delaware (42.3%, a difference of 0.050%), Guyanese (42.3%, a difference of 0.14%), Immigrants from Fiji (42.2%, a difference of 0.14%), and Immigrants from Ecuador (42.2%, a difference of 0.23%).
DemographicsRating | RankAssociate's Degree
Immigrants | Nonimmigrants
1.9
/100
|
#237
Tragic
42.9%
Iroquois
1.7
/100
|
#238
Tragic
42.8%
Immigrants | Grenada
1.3
/100
|
#239
Tragic
42.6%
Cree
1.2
/100
|
#240
Tragic
42.5%
British West Indians
1.0
/100
|
#241
Tragic
42.4%
Immigrants | West Indies
1.0
/100
|
#242
Tragic
42.4%
Guyanese
1.0
/100
|
#243
Tragic
42.3%
Immigrants | Liberia
0.9
/100
|
#244
Tragic
42.3%
Immigrants | Cambodia
0.9
/100
|
#245
Tragic
42.3%
Delaware
0.9
/100
|
#246
Tragic
42.3%
Immigrants | Fiji
0.8
/100
|
#247
Tragic
42.2%
Immigrants | Ecuador
0.8
/100
|
#248
Tragic
42.2%
Jamaicans
0.7
/100
|
#249
Tragic
42.1%
U.S. Virgin Islanders
0.7
/100
|
#250
Tragic
42.1%
Immigrants | Bahamas
0.7
/100
|
#251
Tragic
42.1%