European vs Immigrants from Denmark Disability Age 65 to 74
COMPARE
European
Immigrants from Denmark
Disability Age 65 to 74
Disability Age 65 to 74 Comparison
Europeans
Immigrants from Denmark
23.2%
DISABILITY AGE 65 TO 74
61.2/ 100
METRIC RATING
162nd/ 347
METRIC RANK
21.5%
DISABILITY AGE 65 TO 74
99.5/ 100
METRIC RATING
56th/ 347
METRIC RANK
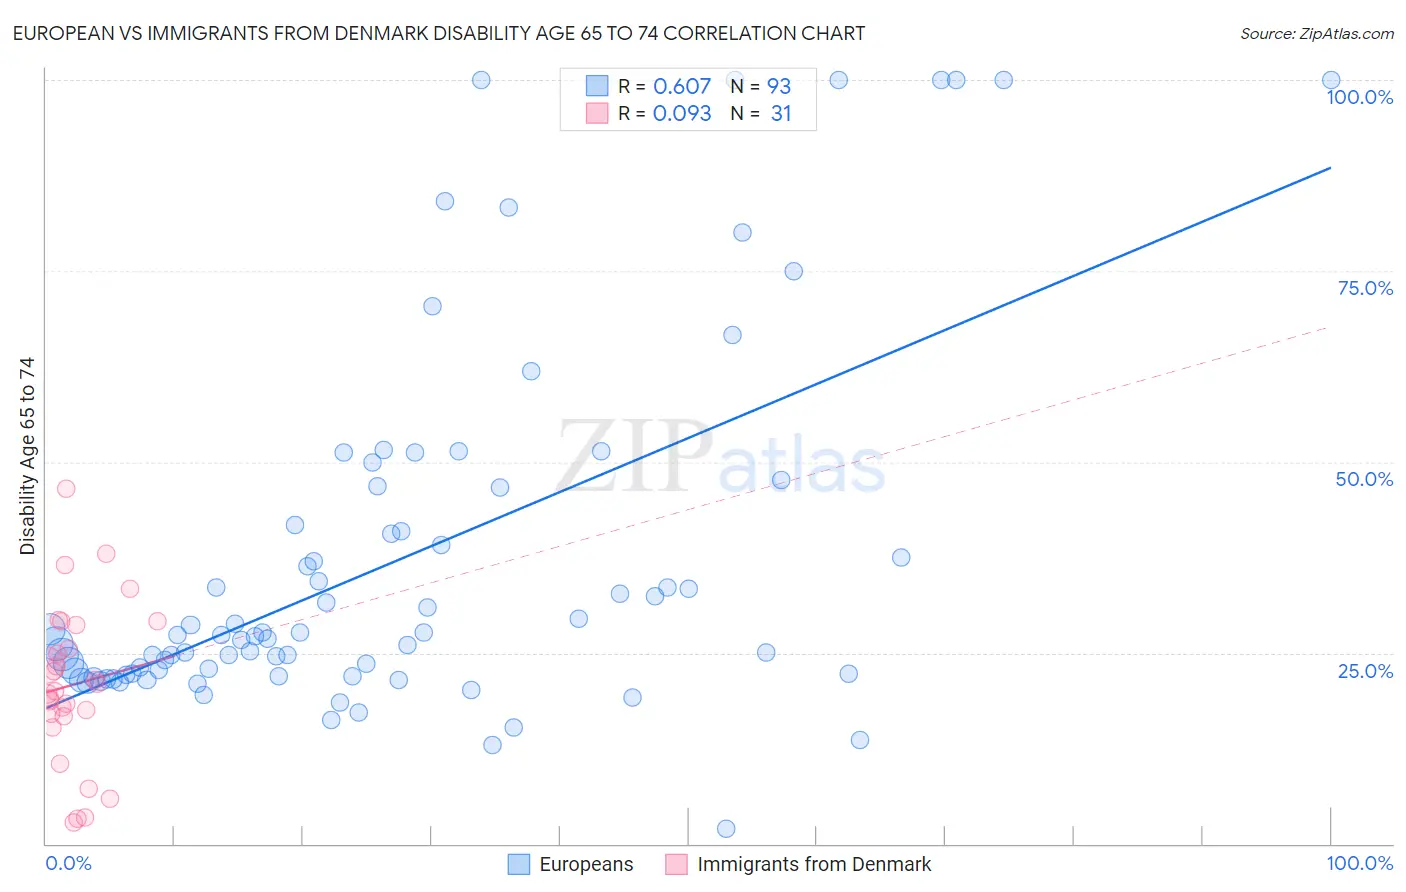
European vs Immigrants from Denmark Disability Age 65 to 74 Correlation Chart
The statistical analysis conducted on geographies consisting of 559,638,797 people shows a significant positive correlation between the proportion of Europeans and percentage of population with a disability between the ages 65 and 75 in the United States with a correlation coefficient (R) of 0.607 and weighted average of 23.2%. Similarly, the statistical analysis conducted on geographies consisting of 136,388,278 people shows a slight positive correlation between the proportion of Immigrants from Denmark and percentage of population with a disability between the ages 65 and 75 in the United States with a correlation coefficient (R) of 0.093 and weighted average of 21.5%, a difference of 7.7%.
Disability Age 65 to 74 Correlation Summary
| Measurement | European | Immigrants from Denmark |
| Minimum | 2.0% | 2.7% |
| Maximum | 100.0% | 46.4% |
| Range | 98.0% | 43.7% |
| Mean | 37.1% | 20.8% |
| Median | 27.4% | 20.0% |
| Interquartile 25% (IQ1) | 22.2% | 16.7% |
| Interquartile 75% (IQ3) | 44.2% | 28.6% |
| Interquartile Range (IQR) | 22.0% | 11.9% |
| Standard Deviation (Sample) | 23.8% | 10.4% |
| Standard Deviation (Population) | 23.7% | 10.2% |
Similar Demographics by Disability Age 65 to 74
Demographics Similar to Europeans by Disability Age 65 to 74
In terms of disability age 65 to 74, the demographic groups most similar to Europeans are Immigrants from Philippines (23.2%, a difference of 0.0%), Sierra Leonean (23.2%, a difference of 0.020%), Vietnamese (23.2%, a difference of 0.030%), Immigrants from Afghanistan (23.2%, a difference of 0.040%), and Immigrants from Cameroon (23.1%, a difference of 0.16%).
| Demographics | Rating | Rank | Disability Age 65 to 74 |
| British | 73.9 /100 | #155 | Good 23.0% |
| Immigrants | Western Asia | 73.8 /100 | #156 | Good 23.0% |
| Czechoslovakians | 72.4 /100 | #157 | Good 23.0% |
| Immigrants | Vietnam | 69.1 /100 | #158 | Good 23.1% |
| South American Indians | 65.5 /100 | #159 | Good 23.1% |
| Koreans | 64.2 /100 | #160 | Good 23.1% |
| Immigrants | Cameroon | 63.8 /100 | #161 | Good 23.1% |
| Europeans | 61.2 /100 | #162 | Good 23.2% |
| Immigrants | Philippines | 61.1 /100 | #163 | Good 23.2% |
| Sierra Leoneans | 60.9 /100 | #164 | Good 23.2% |
| Vietnamese | 60.8 /100 | #165 | Good 23.2% |
| Immigrants | Afghanistan | 60.5 /100 | #166 | Good 23.2% |
| Immigrants | Bosnia and Herzegovina | 57.6 /100 | #167 | Average 23.2% |
| Pakistanis | 57.0 /100 | #168 | Average 23.2% |
| Icelanders | 54.3 /100 | #169 | Average 23.3% |
Demographics Similar to Immigrants from Denmark by Disability Age 65 to 74
In terms of disability age 65 to 74, the demographic groups most similar to Immigrants from Denmark are Immigrants from Romania (21.5%, a difference of 0.020%), Immigrants from Italy (21.5%, a difference of 0.10%), Immigrants from Asia (21.5%, a difference of 0.10%), Immigrants from France (21.5%, a difference of 0.11%), and Bhutanese (21.5%, a difference of 0.11%).
| Demographics | Rating | Rank | Disability Age 65 to 74 |
| Luxembourgers | 99.7 /100 | #49 | Exceptional 21.4% |
| Immigrants | Malaysia | 99.7 /100 | #50 | Exceptional 21.4% |
| Immigrants | Serbia | 99.6 /100 | #51 | Exceptional 21.4% |
| Immigrants | France | 99.6 /100 | #52 | Exceptional 21.5% |
| Bhutanese | 99.6 /100 | #53 | Exceptional 21.5% |
| Immigrants | Italy | 99.6 /100 | #54 | Exceptional 21.5% |
| Immigrants | Romania | 99.5 /100 | #55 | Exceptional 21.5% |
| Immigrants | Denmark | 99.5 /100 | #56 | Exceptional 21.5% |
| Immigrants | Asia | 99.5 /100 | #57 | Exceptional 21.5% |
| Immigrants | Pakistan | 99.5 /100 | #58 | Exceptional 21.5% |
| Zimbabweans | 99.5 /100 | #59 | Exceptional 21.5% |
| Immigrants | North Macedonia | 99.5 /100 | #60 | Exceptional 21.6% |
| Egyptians | 99.5 /100 | #61 | Exceptional 21.6% |
| Carpatho Rusyns | 99.5 /100 | #62 | Exceptional 21.6% |
| Immigrants | Europe | 99.4 /100 | #63 | Exceptional 21.6% |