Chippewa vs Delaware Disability
COMPARE
Chippewa
Delaware
Disability
Disability Comparison
Chippewa
Delaware
14.1%
DISABILITY
0.0/ 100
METRIC RATING
324th/ 347
METRIC RANK
13.6%
DISABILITY
0.0/ 100
METRIC RATING
311th/ 347
METRIC RANK
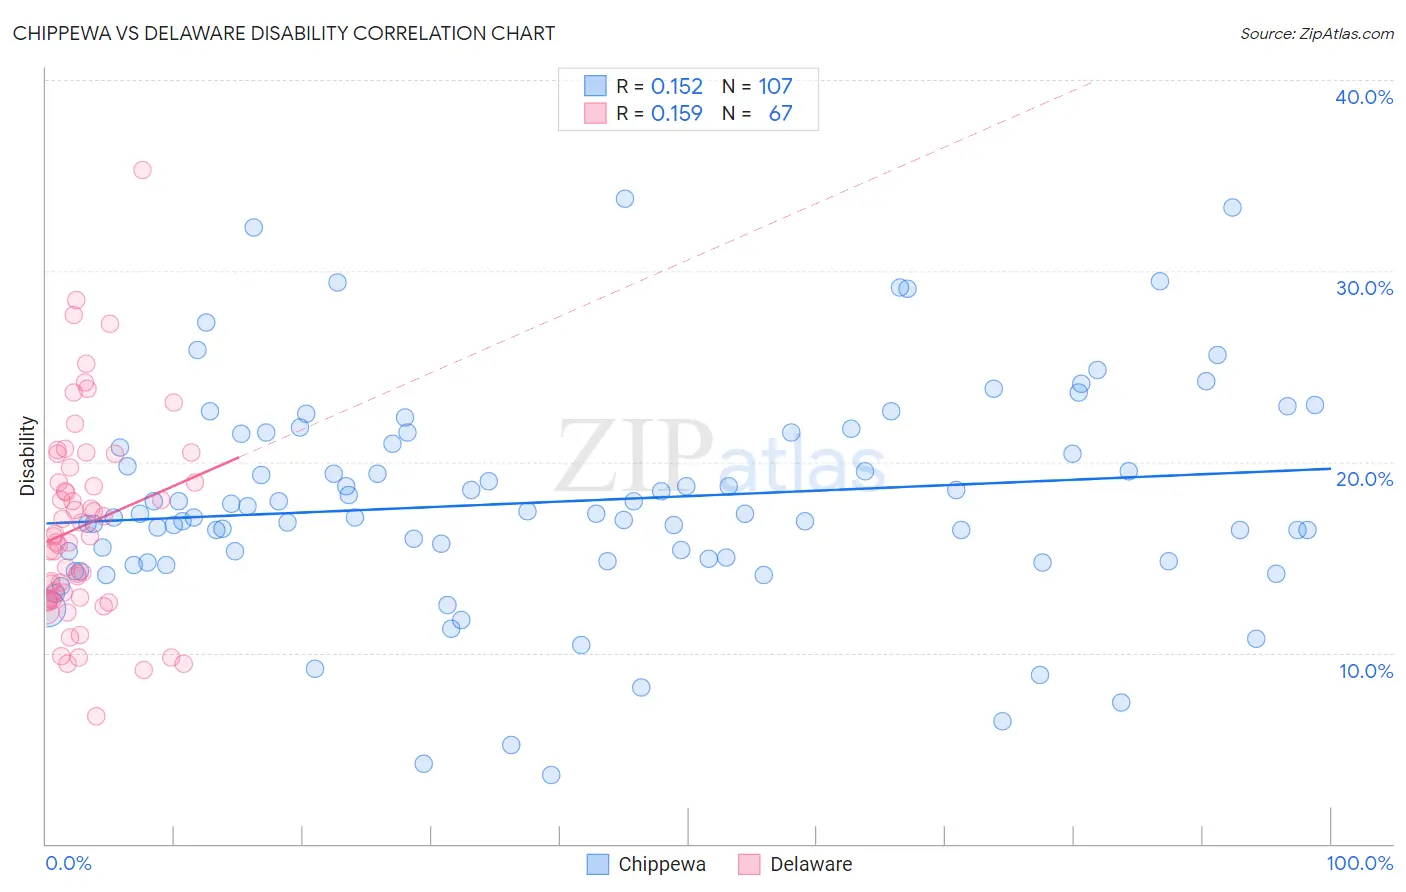
Chippewa vs Delaware Disability Correlation Chart
The statistical analysis conducted on geographies consisting of 215,047,919 people shows a poor positive correlation between the proportion of Chippewa and percentage of population with a disability in the United States with a correlation coefficient (R) of 0.152 and weighted average of 14.1%. Similarly, the statistical analysis conducted on geographies consisting of 96,240,981 people shows a poor positive correlation between the proportion of Delaware and percentage of population with a disability in the United States with a correlation coefficient (R) of 0.159 and weighted average of 13.6%, a difference of 3.9%.
Disability Correlation Summary
| Measurement | Chippewa | Delaware |
| Minimum | 3.6% | 6.7% |
| Maximum | 33.8% | 35.3% |
| Range | 30.2% | 28.6% |
| Mean | 17.9% | 16.7% |
| Median | 17.3% | 16.1% |
| Interquartile 25% (IQ1) | 14.8% | 12.8% |
| Interquartile 75% (IQ3) | 21.5% | 19.7% |
| Interquartile Range (IQR) | 6.7% | 6.9% |
| Standard Deviation (Sample) | 5.7% | 5.3% |
| Standard Deviation (Population) | 5.7% | 5.3% |
Demographics Similar to Chippewa and Delaware by Disability
In terms of disability, the demographic groups most similar to Chippewa are Native/Alaskan (14.2%, a difference of 0.050%), Osage (14.2%, a difference of 0.080%), Ottawa (14.2%, a difference of 0.10%), Comanche (14.1%, a difference of 0.20%), and American (13.9%, a difference of 1.5%). Similarly, the demographic groups most similar to Delaware are Blackfeet (13.6%, a difference of 0.040%), Spanish American (13.6%, a difference of 0.24%), Tlingit-Haida (13.5%, a difference of 0.56%), Cree (13.7%, a difference of 0.59%), and Black/African American (13.7%, a difference of 0.63%).
| Demographics | Rating | Rank | Disability |
| Shoshone | 0.0 /100 | #307 | Tragic 13.5% |
| French American Indians | 0.0 /100 | #308 | Tragic 13.5% |
| Tlingit-Haida | 0.0 /100 | #309 | Tragic 13.5% |
| Blackfeet | 0.0 /100 | #310 | Tragic 13.6% |
| Delaware | 0.0 /100 | #311 | Tragic 13.6% |
| Spanish Americans | 0.0 /100 | #312 | Tragic 13.6% |
| Cree | 0.0 /100 | #313 | Tragic 13.7% |
| Blacks/African Americans | 0.0 /100 | #314 | Tragic 13.7% |
| Puget Sound Salish | 0.0 /100 | #315 | Tragic 13.7% |
| Pima | 0.0 /100 | #316 | Tragic 13.7% |
| Immigrants | Cabo Verde | 0.0 /100 | #317 | Tragic 13.7% |
| Menominee | 0.0 /100 | #318 | Tragic 13.8% |
| Iroquois | 0.0 /100 | #319 | Tragic 13.8% |
| Apache | 0.0 /100 | #320 | Tragic 13.9% |
| Paiute | 0.0 /100 | #321 | Tragic 13.9% |
| Americans | 0.0 /100 | #322 | Tragic 13.9% |
| Comanche | 0.0 /100 | #323 | Tragic 14.1% |
| Chippewa | 0.0 /100 | #324 | Tragic 14.1% |
| Natives/Alaskans | 0.0 /100 | #325 | Tragic 14.2% |
| Osage | 0.0 /100 | #326 | Tragic 14.2% |
| Ottawa | 0.0 /100 | #327 | Tragic 14.2% |