Portuguese vs Spanish American Indian Cognitive Disability
COMPARE
Portuguese
Spanish American Indian
Cognitive Disability
Cognitive Disability Comparison
Portuguese
Spanish American Indians
16.9%
COGNITIVE DISABILITY
94.7/ 100
METRIC RATING
123rd/ 347
METRIC RANK
17.8%
COGNITIVE DISABILITY
2.0/ 100
METRIC RATING
235th/ 347
METRIC RANK
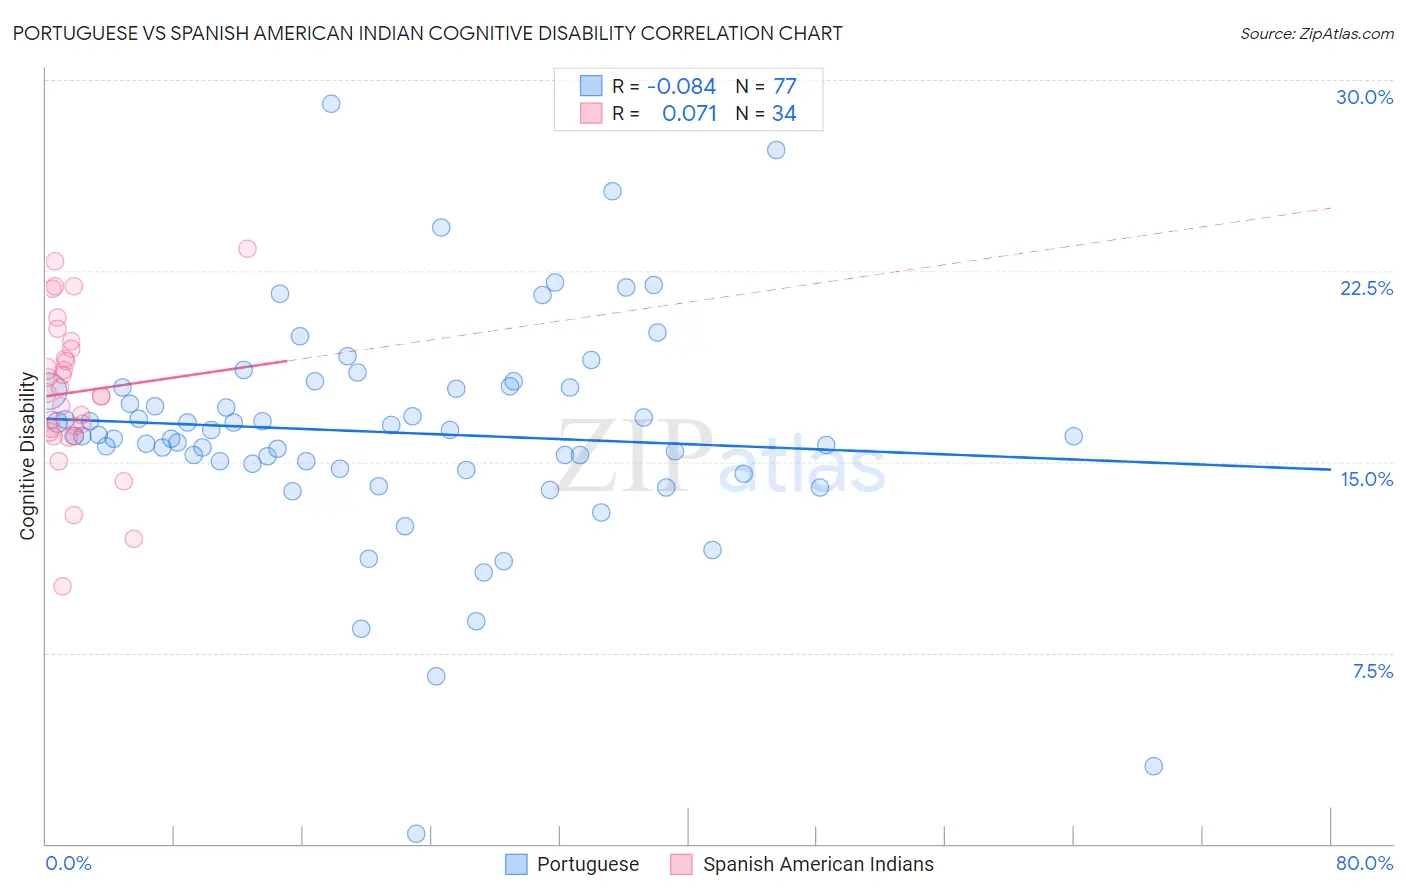
Portuguese vs Spanish American Indian Cognitive Disability Correlation Chart
The statistical analysis conducted on geographies consisting of 450,269,576 people shows a slight negative correlation between the proportion of Portuguese and percentage of population with cognitive disability in the United States with a correlation coefficient (R) of -0.084 and weighted average of 16.9%. Similarly, the statistical analysis conducted on geographies consisting of 73,150,113 people shows a slight positive correlation between the proportion of Spanish American Indians and percentage of population with cognitive disability in the United States with a correlation coefficient (R) of 0.071 and weighted average of 17.8%, a difference of 4.9%.
Cognitive Disability Correlation Summary
| Measurement | Portuguese | Spanish American Indian |
| Minimum | 0.38% | 10.1% |
| Maximum | 29.1% | 23.4% |
| Range | 28.7% | 13.2% |
| Mean | 16.2% | 17.7% |
| Median | 16.0% | 17.6% |
| Interquartile 25% (IQ1) | 14.8% | 16.2% |
| Interquartile 75% (IQ3) | 17.9% | 19.4% |
| Interquartile Range (IQR) | 3.1% | 3.3% |
| Standard Deviation (Sample) | 4.4% | 3.0% |
| Standard Deviation (Population) | 4.4% | 2.9% |
Similar Demographics by Cognitive Disability
Demographics Similar to Portuguese by Cognitive Disability
In terms of cognitive disability, the demographic groups most similar to Portuguese are Immigrants from Western Europe (16.9%, a difference of 0.010%), Turkish (16.9%, a difference of 0.020%), Immigrants from China (16.9%, a difference of 0.030%), Scottish (16.9%, a difference of 0.040%), and Scandinavian (16.9%, a difference of 0.080%).
| Demographics | Rating | Rank | Cognitive Disability |
| Inupiat | 96.5 /100 | #116 | Exceptional 16.9% |
| Immigrants | Japan | 96.2 /100 | #117 | Exceptional 16.9% |
| Immigrants | Denmark | 96.2 /100 | #118 | Exceptional 16.9% |
| South Africans | 95.5 /100 | #119 | Exceptional 16.9% |
| Scottish | 95.0 /100 | #120 | Exceptional 16.9% |
| Immigrants | China | 94.9 /100 | #121 | Exceptional 16.9% |
| Immigrants | Western Europe | 94.8 /100 | #122 | Exceptional 16.9% |
| Portuguese | 94.7 /100 | #123 | Exceptional 16.9% |
| Turks | 94.5 /100 | #124 | Exceptional 16.9% |
| Scandinavians | 94.1 /100 | #125 | Exceptional 16.9% |
| Europeans | 93.4 /100 | #126 | Exceptional 17.0% |
| Immigrants | Costa Rica | 93.1 /100 | #127 | Exceptional 17.0% |
| Nicaraguans | 93.0 /100 | #128 | Exceptional 17.0% |
| Immigrants | Uruguay | 92.9 /100 | #129 | Exceptional 17.0% |
| Immigrants | Vietnam | 92.4 /100 | #130 | Exceptional 17.0% |
Demographics Similar to Spanish American Indians by Cognitive Disability
In terms of cognitive disability, the demographic groups most similar to Spanish American Indians are Osage (17.8%, a difference of 0.0%), Guatemalan (17.8%, a difference of 0.020%), Tongan (17.8%, a difference of 0.020%), Panamanian (17.8%, a difference of 0.020%), and Mongolian (17.7%, a difference of 0.060%).
| Demographics | Rating | Rank | Cognitive Disability |
| Immigrants | Central America | 2.3 /100 | #228 | Tragic 17.7% |
| Immigrants | Guatemala | 2.2 /100 | #229 | Tragic 17.7% |
| Mongolians | 2.2 /100 | #230 | Tragic 17.7% |
| Guatemalans | 2.1 /100 | #231 | Tragic 17.8% |
| Tongans | 2.1 /100 | #232 | Tragic 17.8% |
| Panamanians | 2.1 /100 | #233 | Tragic 17.8% |
| Osage | 2.0 /100 | #234 | Tragic 17.8% |
| Spanish American Indians | 2.0 /100 | #235 | Tragic 17.8% |
| Immigrants | Iraq | 1.8 /100 | #236 | Tragic 17.8% |
| Immigrants | Mexico | 1.8 /100 | #237 | Tragic 17.8% |
| Cheyenne | 1.7 /100 | #238 | Tragic 17.8% |
| Cajuns | 1.4 /100 | #239 | Tragic 17.8% |
| Iraqis | 1.4 /100 | #240 | Tragic 17.8% |
| Mexicans | 1.1 /100 | #241 | Tragic 17.8% |
| Paiute | 1.1 /100 | #242 | Tragic 17.8% |