Cambodian vs Immigrants from Ghana Vision Disability
COMPARE
Cambodian
Immigrants from Ghana
Vision Disability
Vision Disability Comparison
Cambodians
Immigrants from Ghana
2.0%
VISION DISABILITY
99.8/ 100
METRIC RATING
36th/ 347
METRIC RANK
2.2%
VISION DISABILITY
8.9/ 100
METRIC RATING
213th/ 347
METRIC RANK
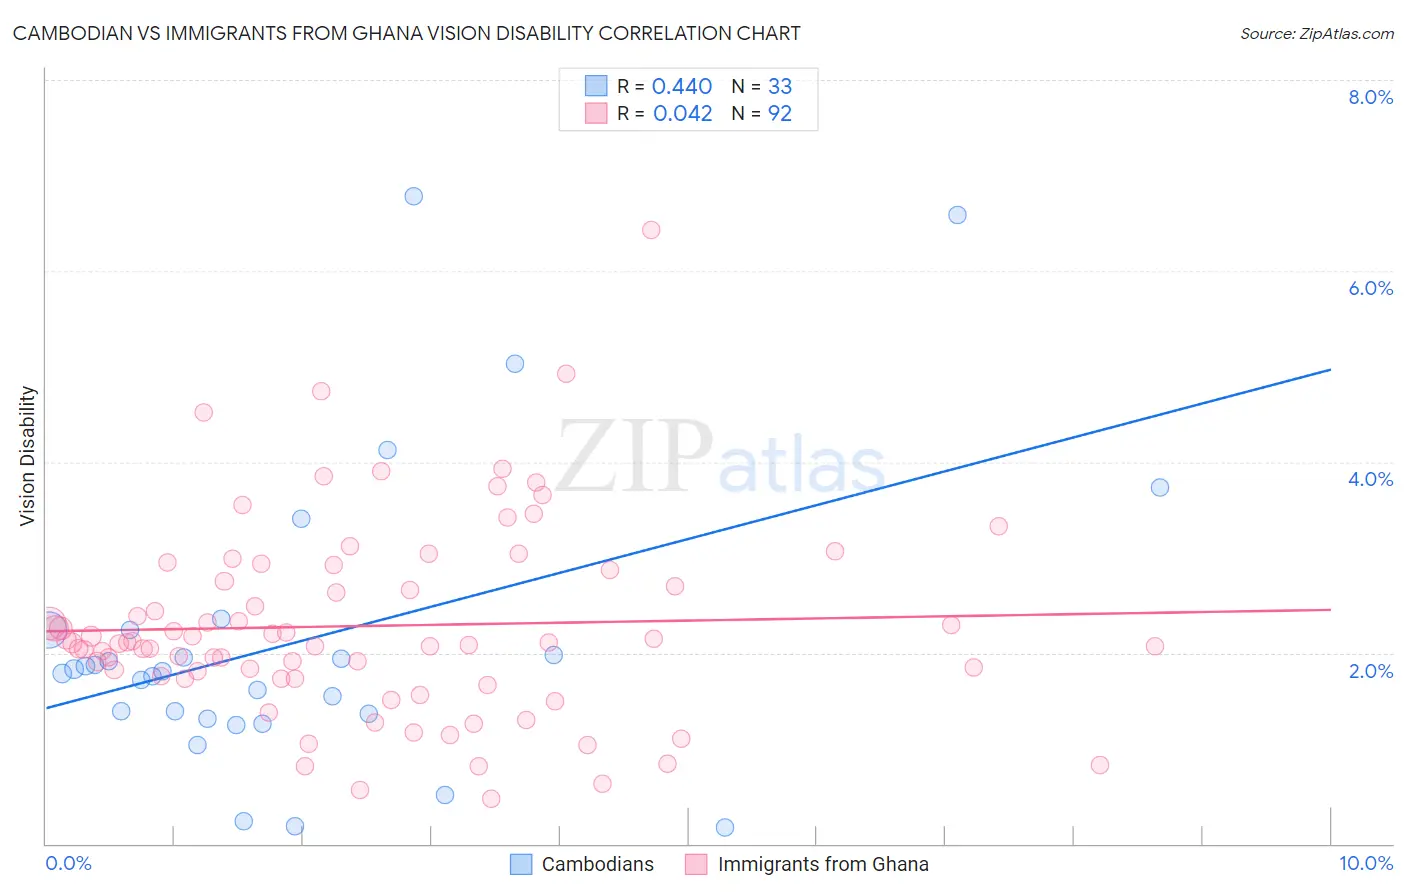
Cambodian vs Immigrants from Ghana Vision Disability Correlation Chart
The statistical analysis conducted on geographies consisting of 102,480,500 people shows a moderate positive correlation between the proportion of Cambodians and percentage of population with vision disability in the United States with a correlation coefficient (R) of 0.440 and weighted average of 2.0%. Similarly, the statistical analysis conducted on geographies consisting of 199,859,756 people shows no correlation between the proportion of Immigrants from Ghana and percentage of population with vision disability in the United States with a correlation coefficient (R) of 0.042 and weighted average of 2.2%, a difference of 14.8%.
Vision Disability Correlation Summary
| Measurement | Cambodian | Immigrants from Ghana |
| Minimum | 0.17% | 0.47% |
| Maximum | 6.8% | 6.4% |
| Range | 6.6% | 6.0% |
| Mean | 2.1% | 2.3% |
| Median | 1.8% | 2.1% |
| Interquartile 25% (IQ1) | 1.3% | 1.7% |
| Interquartile 75% (IQ3) | 2.2% | 2.8% |
| Interquartile Range (IQR) | 0.90% | 1.1% |
| Standard Deviation (Sample) | 1.6% | 1.0% |
| Standard Deviation (Population) | 1.5% | 1.0% |
Similar Demographics by Vision Disability
Demographics Similar to Cambodians by Vision Disability
In terms of vision disability, the demographic groups most similar to Cambodians are Bhutanese (2.0%, a difference of 0.25%), Immigrants from Kuwait (2.0%, a difference of 0.29%), Zimbabwean (2.0%, a difference of 0.34%), Immigrants from Australia (1.9%, a difference of 0.35%), and Immigrants from Turkey (1.9%, a difference of 0.44%).
| Demographics | Rating | Rank | Vision Disability |
| Egyptians | 99.9 /100 | #29 | Exceptional 1.9% |
| Immigrants | Nepal | 99.9 /100 | #30 | Exceptional 1.9% |
| Mongolians | 99.9 /100 | #31 | Exceptional 1.9% |
| Luxembourgers | 99.9 /100 | #32 | Exceptional 1.9% |
| Immigrants | Egypt | 99.9 /100 | #33 | Exceptional 1.9% |
| Immigrants | Turkey | 99.8 /100 | #34 | Exceptional 1.9% |
| Immigrants | Australia | 99.8 /100 | #35 | Exceptional 1.9% |
| Cambodians | 99.8 /100 | #36 | Exceptional 2.0% |
| Bhutanese | 99.8 /100 | #37 | Exceptional 2.0% |
| Immigrants | Kuwait | 99.8 /100 | #38 | Exceptional 2.0% |
| Zimbabweans | 99.7 /100 | #39 | Exceptional 2.0% |
| Immigrants | Ireland | 99.7 /100 | #40 | Exceptional 2.0% |
| Cypriots | 99.7 /100 | #41 | Exceptional 2.0% |
| Immigrants | Ethiopia | 99.7 /100 | #42 | Exceptional 2.0% |
| Eastern Europeans | 99.7 /100 | #43 | Exceptional 2.0% |
Demographics Similar to Immigrants from Ghana by Vision Disability
In terms of vision disability, the demographic groups most similar to Immigrants from Ghana are Bermudan (2.2%, a difference of 0.010%), Indonesian (2.2%, a difference of 0.10%), Trinidadian and Tobagonian (2.2%, a difference of 0.13%), Nigerian (2.3%, a difference of 0.34%), and Immigrants from Uruguay (2.2%, a difference of 0.44%).
| Demographics | Rating | Rank | Vision Disability |
| Pennsylvania Germans | 14.5 /100 | #206 | Poor 2.2% |
| Immigrants | Nigeria | 13.5 /100 | #207 | Poor 2.2% |
| Germans | 13.4 /100 | #208 | Poor 2.2% |
| Immigrants | Brazil | 13.1 /100 | #209 | Poor 2.2% |
| Immigrants | Uruguay | 11.5 /100 | #210 | Poor 2.2% |
| Indonesians | 9.5 /100 | #211 | Tragic 2.2% |
| Bermudans | 9.0 /100 | #212 | Tragic 2.2% |
| Immigrants | Ghana | 8.9 /100 | #213 | Tragic 2.2% |
| Trinidadians and Tobagonians | 8.2 /100 | #214 | Tragic 2.2% |
| Nigerians | 7.2 /100 | #215 | Tragic 2.3% |
| Immigrants | Trinidad and Tobago | 6.1 /100 | #216 | Tragic 2.3% |
| Barbadians | 5.1 /100 | #217 | Tragic 2.3% |
| Portuguese | 4.9 /100 | #218 | Tragic 2.3% |
| Ecuadorians | 4.6 /100 | #219 | Tragic 2.3% |
| Guamanians/Chamorros | 3.9 /100 | #220 | Tragic 2.3% |