Cambodian vs Immigrants from Scotland Vision Disability
COMPARE
Cambodian
Immigrants from Scotland
Vision Disability
Vision Disability Comparison
Cambodians
Immigrants from Scotland
2.0%
VISION DISABILITY
99.8/ 100
METRIC RATING
36th/ 347
METRIC RANK
2.1%
VISION DISABILITY
90.4/ 100
METRIC RATING
121st/ 347
METRIC RANK
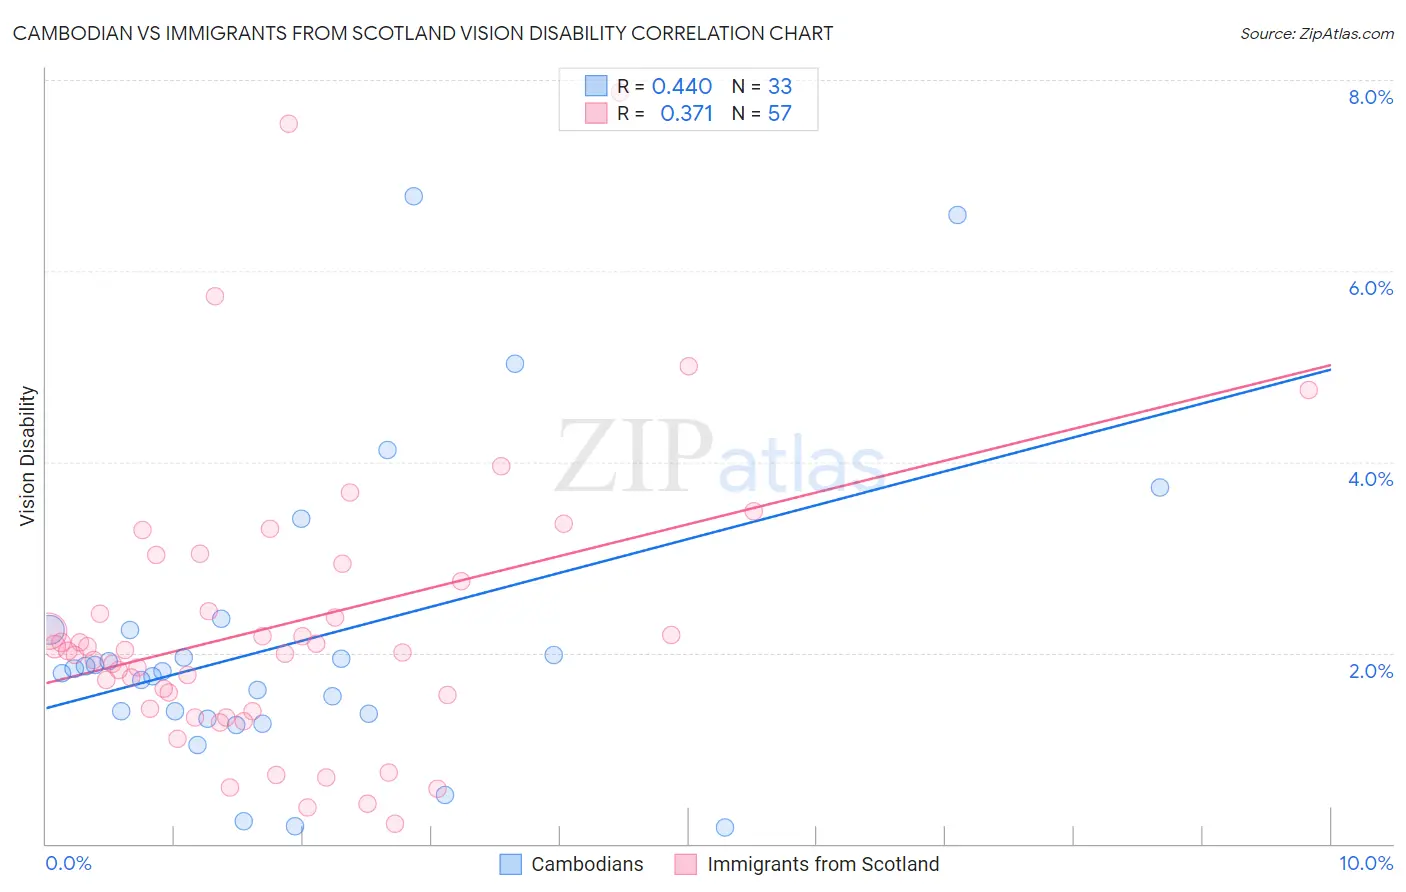
Cambodian vs Immigrants from Scotland Vision Disability Correlation Chart
The statistical analysis conducted on geographies consisting of 102,480,500 people shows a moderate positive correlation between the proportion of Cambodians and percentage of population with vision disability in the United States with a correlation coefficient (R) of 0.440 and weighted average of 2.0%. Similarly, the statistical analysis conducted on geographies consisting of 196,324,297 people shows a mild positive correlation between the proportion of Immigrants from Scotland and percentage of population with vision disability in the United States with a correlation coefficient (R) of 0.371 and weighted average of 2.1%, a difference of 6.9%.
Vision Disability Correlation Summary
| Measurement | Cambodian | Immigrants from Scotland |
| Minimum | 0.17% | 0.21% |
| Maximum | 6.8% | 7.9% |
| Range | 6.6% | 7.7% |
| Mean | 2.1% | 2.3% |
| Median | 1.8% | 2.0% |
| Interquartile 25% (IQ1) | 1.3% | 1.4% |
| Interquartile 75% (IQ3) | 2.2% | 2.8% |
| Interquartile Range (IQR) | 0.90% | 1.4% |
| Standard Deviation (Sample) | 1.6% | 1.5% |
| Standard Deviation (Population) | 1.5% | 1.5% |
Similar Demographics by Vision Disability
Demographics Similar to Cambodians by Vision Disability
In terms of vision disability, the demographic groups most similar to Cambodians are Bhutanese (2.0%, a difference of 0.25%), Immigrants from Kuwait (2.0%, a difference of 0.29%), Zimbabwean (2.0%, a difference of 0.34%), Immigrants from Australia (1.9%, a difference of 0.35%), and Immigrants from Turkey (1.9%, a difference of 0.44%).
| Demographics | Rating | Rank | Vision Disability |
| Egyptians | 99.9 /100 | #29 | Exceptional 1.9% |
| Immigrants | Nepal | 99.9 /100 | #30 | Exceptional 1.9% |
| Mongolians | 99.9 /100 | #31 | Exceptional 1.9% |
| Luxembourgers | 99.9 /100 | #32 | Exceptional 1.9% |
| Immigrants | Egypt | 99.9 /100 | #33 | Exceptional 1.9% |
| Immigrants | Turkey | 99.8 /100 | #34 | Exceptional 1.9% |
| Immigrants | Australia | 99.8 /100 | #35 | Exceptional 1.9% |
| Cambodians | 99.8 /100 | #36 | Exceptional 2.0% |
| Bhutanese | 99.8 /100 | #37 | Exceptional 2.0% |
| Immigrants | Kuwait | 99.8 /100 | #38 | Exceptional 2.0% |
| Zimbabweans | 99.7 /100 | #39 | Exceptional 2.0% |
| Immigrants | Ireland | 99.7 /100 | #40 | Exceptional 2.0% |
| Cypriots | 99.7 /100 | #41 | Exceptional 2.0% |
| Immigrants | Ethiopia | 99.7 /100 | #42 | Exceptional 2.0% |
| Eastern Europeans | 99.7 /100 | #43 | Exceptional 2.0% |
Demographics Similar to Immigrants from Scotland by Vision Disability
In terms of vision disability, the demographic groups most similar to Immigrants from Scotland are Immigrants from Ukraine (2.1%, a difference of 0.010%), Immigrants from Albania (2.1%, a difference of 0.010%), Immigrants from Spain (2.1%, a difference of 0.11%), Immigrants from Zimbabwe (2.1%, a difference of 0.12%), and Immigrants from Venezuela (2.1%, a difference of 0.12%).
| Demographics | Rating | Rank | Vision Disability |
| Croatians | 92.3 /100 | #114 | Exceptional 2.1% |
| Immigrants | Vietnam | 92.2 /100 | #115 | Exceptional 2.1% |
| Ugandans | 92.2 /100 | #116 | Exceptional 2.1% |
| Poles | 92.0 /100 | #117 | Exceptional 2.1% |
| Immigrants | Philippines | 91.4 /100 | #118 | Exceptional 2.1% |
| Immigrants | Uganda | 91.4 /100 | #119 | Exceptional 2.1% |
| Immigrants | Zimbabwe | 91.0 /100 | #120 | Exceptional 2.1% |
| Immigrants | Scotland | 90.4 /100 | #121 | Exceptional 2.1% |
| Immigrants | Ukraine | 90.4 /100 | #122 | Exceptional 2.1% |
| Immigrants | Albania | 90.4 /100 | #123 | Exceptional 2.1% |
| Immigrants | Spain | 89.8 /100 | #124 | Excellent 2.1% |
| Immigrants | Venezuela | 89.8 /100 | #125 | Excellent 2.1% |
| Immigrants | Peru | 89.5 /100 | #126 | Excellent 2.1% |
| Sudanese | 89.2 /100 | #127 | Excellent 2.1% |
| Immigrants | Chile | 89.0 /100 | #128 | Excellent 2.1% |