Black/African American vs Israeli Disability Age 35 to 64
COMPARE
Black/African American
Israeli
Disability Age 35 to 64
Disability Age 35 to 64 Comparison
Blacks/African Americans
Israelis
14.7%
DISABILITY AGE 35 TO 64
0.0/ 100
METRIC RATING
320th/ 347
METRIC RANK
9.7%
DISABILITY AGE 35 TO 64
99.9/ 100
METRIC RATING
41st/ 347
METRIC RANK
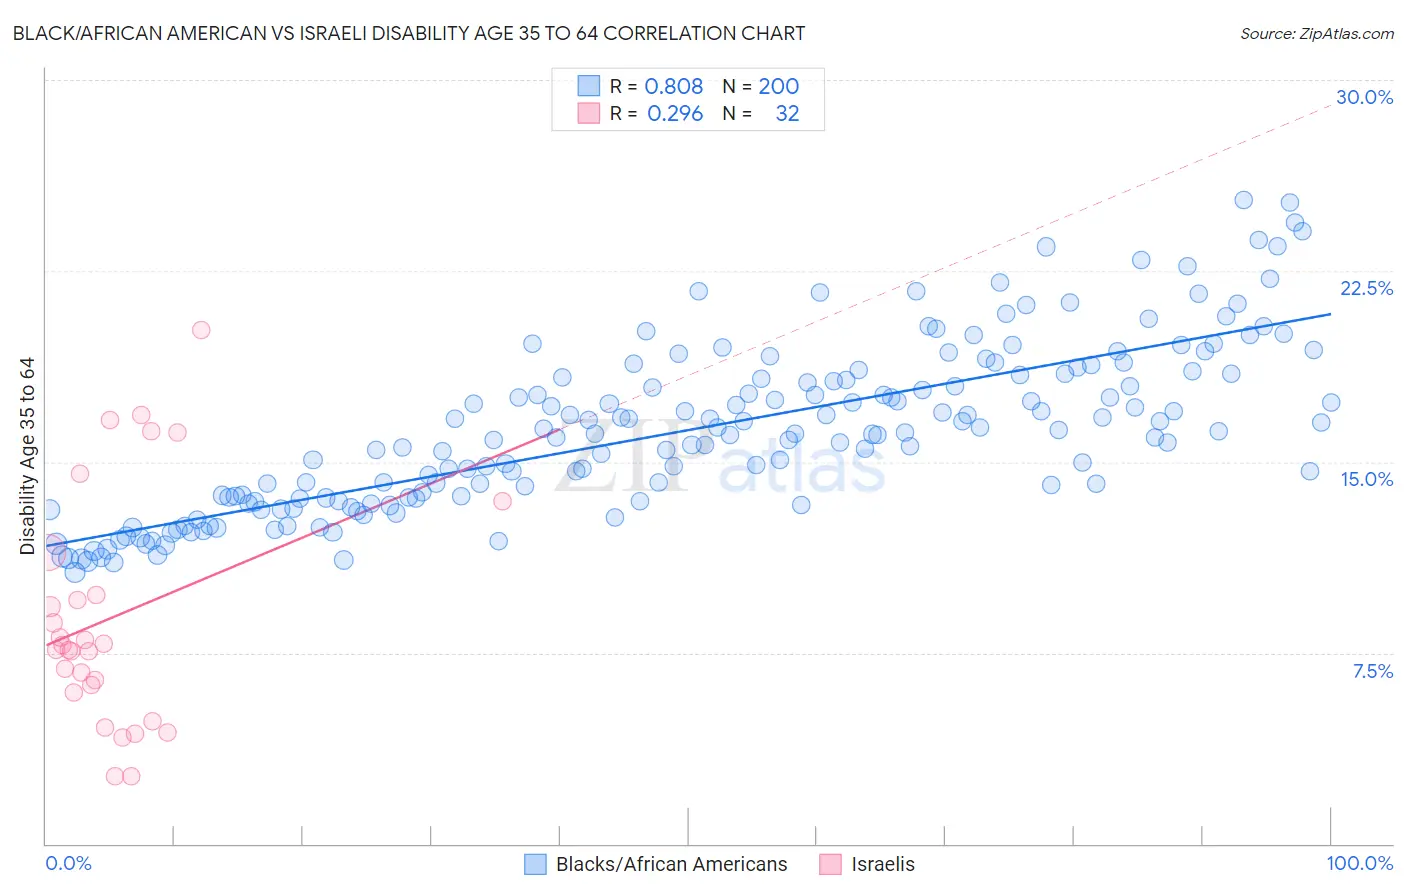
Black/African American vs Israeli Disability Age 35 to 64 Correlation Chart
The statistical analysis conducted on geographies consisting of 565,040,729 people shows a very strong positive correlation between the proportion of Blacks/African Americans and percentage of population with a disability between the ages 34 and 64 in the United States with a correlation coefficient (R) of 0.808 and weighted average of 14.7%. Similarly, the statistical analysis conducted on geographies consisting of 210,999,934 people shows a weak positive correlation between the proportion of Israelis and percentage of population with a disability between the ages 34 and 64 in the United States with a correlation coefficient (R) of 0.296 and weighted average of 9.7%, a difference of 51.2%.
Disability Age 35 to 64 Correlation Summary
| Measurement | Black/African American | Israeli |
| Minimum | 10.7% | 2.6% |
| Maximum | 25.3% | 20.2% |
| Range | 14.7% | 17.5% |
| Mean | 16.3% | 8.9% |
| Median | 16.1% | 7.7% |
| Interquartile 25% (IQ1) | 13.6% | 6.1% |
| Interquartile 75% (IQ3) | 18.4% | 10.6% |
| Interquartile Range (IQR) | 4.8% | 4.5% |
| Standard Deviation (Sample) | 3.3% | 4.5% |
| Standard Deviation (Population) | 3.3% | 4.5% |
Similar Demographics by Disability Age 35 to 64
Demographics Similar to Blacks/African Americans by Disability Age 35 to 64
In terms of disability age 35 to 64, the demographic groups most similar to Blacks/African Americans are Immigrants from Cabo Verde (14.7%, a difference of 0.15%), Comanche (14.7%, a difference of 0.26%), Potawatomi (14.8%, a difference of 0.30%), Ottawa (14.6%, a difference of 0.57%), and Crow (14.6%, a difference of 0.64%).
| Demographics | Rating | Rank | Disability Age 35 to 64 |
| Iroquois | 0.0 /100 | #313 | Tragic 14.4% |
| Shoshone | 0.0 /100 | #314 | Tragic 14.5% |
| Alaska Natives | 0.0 /100 | #315 | Tragic 14.5% |
| Osage | 0.0 /100 | #316 | Tragic 14.5% |
| Crow | 0.0 /100 | #317 | Tragic 14.6% |
| Ottawa | 0.0 /100 | #318 | Tragic 14.6% |
| Immigrants | Cabo Verde | 0.0 /100 | #319 | Tragic 14.7% |
| Blacks/African Americans | 0.0 /100 | #320 | Tragic 14.7% |
| Comanche | 0.0 /100 | #321 | Tragic 14.7% |
| Potawatomi | 0.0 /100 | #322 | Tragic 14.8% |
| Apache | 0.0 /100 | #323 | Tragic 14.9% |
| Chippewa | 0.0 /100 | #324 | Tragic 15.0% |
| Arapaho | 0.0 /100 | #325 | Tragic 15.1% |
| Natives/Alaskans | 0.0 /100 | #326 | Tragic 15.3% |
| Pueblo | 0.0 /100 | #327 | Tragic 15.3% |
Demographics Similar to Israelis by Disability Age 35 to 64
In terms of disability age 35 to 64, the demographic groups most similar to Israelis are Immigrants from Armenia (9.7%, a difference of 0.12%), Immigrants from Belarus (9.7%, a difference of 0.18%), Immigrants from Malaysia (9.7%, a difference of 0.23%), Egyptian (9.7%, a difference of 0.35%), and Immigrants from Colombia (9.8%, a difference of 0.35%).
| Demographics | Rating | Rank | Disability Age 35 to 64 |
| Immigrants | Australia | 99.9 /100 | #34 | Exceptional 9.7% |
| Bulgarians | 99.9 /100 | #35 | Exceptional 9.7% |
| Immigrants | Cuba | 99.9 /100 | #36 | Exceptional 9.7% |
| Immigrants | Turkey | 99.9 /100 | #37 | Exceptional 9.7% |
| Egyptians | 99.9 /100 | #38 | Exceptional 9.7% |
| Immigrants | Belarus | 99.9 /100 | #39 | Exceptional 9.7% |
| Immigrants | Armenia | 99.9 /100 | #40 | Exceptional 9.7% |
| Israelis | 99.9 /100 | #41 | Exceptional 9.7% |
| Immigrants | Malaysia | 99.9 /100 | #42 | Exceptional 9.7% |
| Immigrants | Colombia | 99.9 /100 | #43 | Exceptional 9.8% |
| Immigrants | Egypt | 99.9 /100 | #44 | Exceptional 9.8% |
| Immigrants | Peru | 99.9 /100 | #45 | Exceptional 9.8% |
| Cambodians | 99.8 /100 | #46 | Exceptional 9.8% |
| Immigrants | Belgium | 99.8 /100 | #47 | Exceptional 9.8% |
| Immigrants | Serbia | 99.8 /100 | #48 | Exceptional 9.8% |