Immigrants from Australia vs Israeli Disability Age 35 to 64
COMPARE
Immigrants from Australia
Israeli
Disability Age 35 to 64
Disability Age 35 to 64 Comparison
Immigrants from Australia
Israelis
9.7%
DISABILITY AGE 35 TO 64
99.9/ 100
METRIC RATING
34th/ 347
METRIC RANK
9.7%
DISABILITY AGE 35 TO 64
99.9/ 100
METRIC RATING
41st/ 347
METRIC RANK
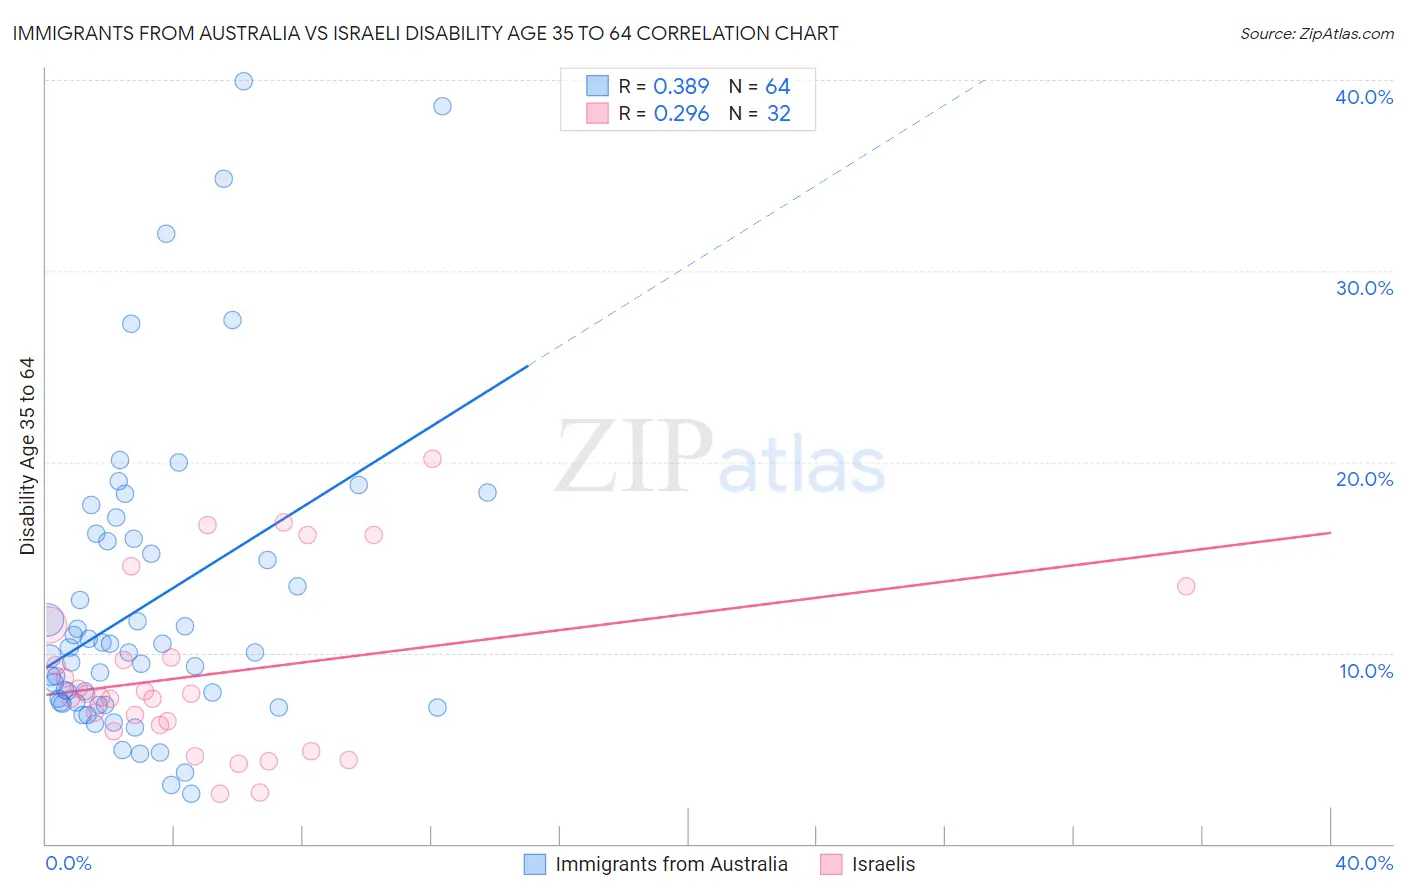
Immigrants from Australia vs Israeli Disability Age 35 to 64 Correlation Chart
The statistical analysis conducted on geographies consisting of 227,131,013 people shows a mild positive correlation between the proportion of Immigrants from Australia and percentage of population with a disability between the ages 34 and 64 in the United States with a correlation coefficient (R) of 0.389 and weighted average of 9.7%. Similarly, the statistical analysis conducted on geographies consisting of 210,999,934 people shows a weak positive correlation between the proportion of Israelis and percentage of population with a disability between the ages 34 and 64 in the United States with a correlation coefficient (R) of 0.296 and weighted average of 9.7%, a difference of 0.64%.
Disability Age 35 to 64 Correlation Summary
| Measurement | Immigrants from Australia | Israeli |
| Minimum | 2.6% | 2.6% |
| Maximum | 40.0% | 20.2% |
| Range | 37.3% | 17.5% |
| Mean | 12.5% | 8.9% |
| Median | 10.0% | 7.7% |
| Interquartile 25% (IQ1) | 7.3% | 6.1% |
| Interquartile 75% (IQ3) | 15.9% | 10.6% |
| Interquartile Range (IQR) | 8.6% | 4.5% |
| Standard Deviation (Sample) | 8.1% | 4.5% |
| Standard Deviation (Population) | 8.1% | 4.5% |
Demographics Similar to Immigrants from Australia and Israelis by Disability Age 35 to 64
In terms of disability age 35 to 64, the demographic groups most similar to Immigrants from Australia are Immigrants from Indonesia (9.7%, a difference of 0.070%), Bulgarian (9.7%, a difference of 0.10%), Immigrants from Cuba (9.7%, a difference of 0.14%), Turkish (9.7%, a difference of 0.15%), and Immigrants from Turkey (9.7%, a difference of 0.22%). Similarly, the demographic groups most similar to Israelis are Immigrants from Armenia (9.7%, a difference of 0.12%), Immigrants from Belarus (9.7%, a difference of 0.18%), Immigrants from Malaysia (9.7%, a difference of 0.23%), Egyptian (9.7%, a difference of 0.35%), and Immigrants from Colombia (9.8%, a difference of 0.35%).
| Demographics | Rating | Rank | Disability Age 35 to 64 |
| Immigrants | Asia | 100.0 /100 | #27 | Exceptional 9.5% |
| Immigrants | Pakistan | 100.0 /100 | #28 | Exceptional 9.5% |
| Immigrants | Ireland | 100.0 /100 | #29 | Exceptional 9.5% |
| Immigrants | Japan | 100.0 /100 | #30 | Exceptional 9.5% |
| Immigrants | Lithuania | 99.9 /100 | #31 | Exceptional 9.6% |
| Turks | 99.9 /100 | #32 | Exceptional 9.7% |
| Immigrants | Indonesia | 99.9 /100 | #33 | Exceptional 9.7% |
| Immigrants | Australia | 99.9 /100 | #34 | Exceptional 9.7% |
| Bulgarians | 99.9 /100 | #35 | Exceptional 9.7% |
| Immigrants | Cuba | 99.9 /100 | #36 | Exceptional 9.7% |
| Immigrants | Turkey | 99.9 /100 | #37 | Exceptional 9.7% |
| Egyptians | 99.9 /100 | #38 | Exceptional 9.7% |
| Immigrants | Belarus | 99.9 /100 | #39 | Exceptional 9.7% |
| Immigrants | Armenia | 99.9 /100 | #40 | Exceptional 9.7% |
| Israelis | 99.9 /100 | #41 | Exceptional 9.7% |
| Immigrants | Malaysia | 99.9 /100 | #42 | Exceptional 9.7% |
| Immigrants | Colombia | 99.9 /100 | #43 | Exceptional 9.8% |
| Immigrants | Egypt | 99.9 /100 | #44 | Exceptional 9.8% |
| Immigrants | Peru | 99.9 /100 | #45 | Exceptional 9.8% |
| Cambodians | 99.8 /100 | #46 | Exceptional 9.8% |
| Immigrants | Belgium | 99.8 /100 | #47 | Exceptional 9.8% |