Black/African American vs Immigrants from Turkey Disability Age 35 to 64
COMPARE
Black/African American
Immigrants from Turkey
Disability Age 35 to 64
Disability Age 35 to 64 Comparison
Blacks/African Americans
Immigrants from Turkey
14.7%
DISABILITY AGE 35 TO 64
0.0/ 100
METRIC RATING
320th/ 347
METRIC RANK
9.7%
DISABILITY AGE 35 TO 64
99.9/ 100
METRIC RATING
37th/ 347
METRIC RANK
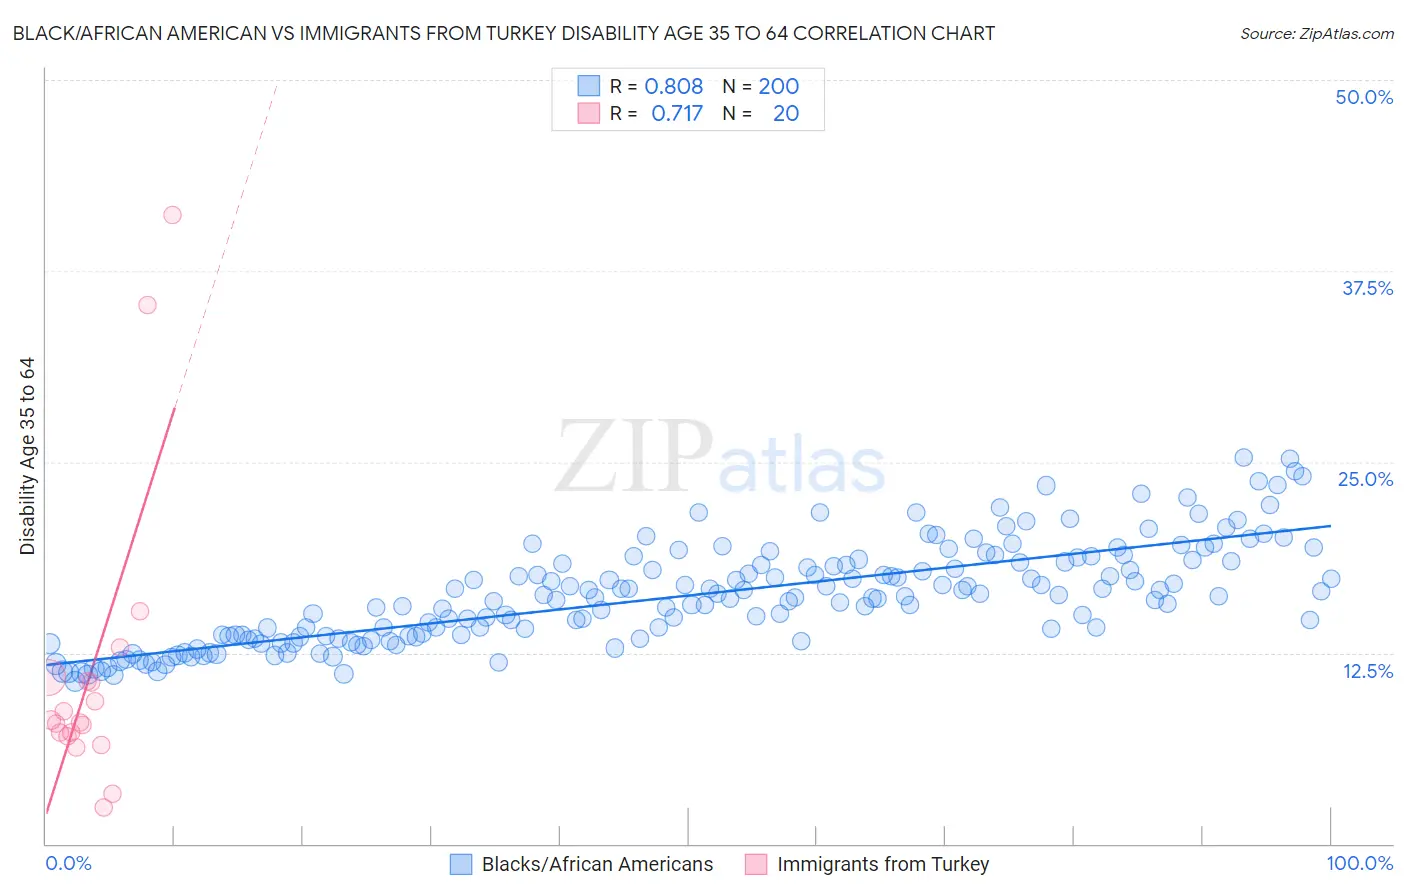
Black/African American vs Immigrants from Turkey Disability Age 35 to 64 Correlation Chart
The statistical analysis conducted on geographies consisting of 565,040,729 people shows a very strong positive correlation between the proportion of Blacks/African Americans and percentage of population with a disability between the ages 34 and 64 in the United States with a correlation coefficient (R) of 0.808 and weighted average of 14.7%. Similarly, the statistical analysis conducted on geographies consisting of 222,955,672 people shows a strong positive correlation between the proportion of Immigrants from Turkey and percentage of population with a disability between the ages 34 and 64 in the United States with a correlation coefficient (R) of 0.717 and weighted average of 9.7%, a difference of 51.9%.
Disability Age 35 to 64 Correlation Summary
| Measurement | Black/African American | Immigrants from Turkey |
| Minimum | 10.7% | 2.4% |
| Maximum | 25.3% | 41.2% |
| Range | 14.7% | 38.8% |
| Mean | 16.3% | 11.3% |
| Median | 16.1% | 8.0% |
| Interquartile 25% (IQ1) | 13.6% | 7.1% |
| Interquartile 75% (IQ3) | 18.4% | 10.7% |
| Interquartile Range (IQR) | 4.8% | 3.6% |
| Standard Deviation (Sample) | 3.3% | 9.7% |
| Standard Deviation (Population) | 3.3% | 9.5% |
Similar Demographics by Disability Age 35 to 64
Demographics Similar to Blacks/African Americans by Disability Age 35 to 64
In terms of disability age 35 to 64, the demographic groups most similar to Blacks/African Americans are Immigrants from Cabo Verde (14.7%, a difference of 0.15%), Comanche (14.7%, a difference of 0.26%), Potawatomi (14.8%, a difference of 0.30%), Ottawa (14.6%, a difference of 0.57%), and Crow (14.6%, a difference of 0.64%).
| Demographics | Rating | Rank | Disability Age 35 to 64 |
| Iroquois | 0.0 /100 | #313 | Tragic 14.4% |
| Shoshone | 0.0 /100 | #314 | Tragic 14.5% |
| Alaska Natives | 0.0 /100 | #315 | Tragic 14.5% |
| Osage | 0.0 /100 | #316 | Tragic 14.5% |
| Crow | 0.0 /100 | #317 | Tragic 14.6% |
| Ottawa | 0.0 /100 | #318 | Tragic 14.6% |
| Immigrants | Cabo Verde | 0.0 /100 | #319 | Tragic 14.7% |
| Blacks/African Americans | 0.0 /100 | #320 | Tragic 14.7% |
| Comanche | 0.0 /100 | #321 | Tragic 14.7% |
| Potawatomi | 0.0 /100 | #322 | Tragic 14.8% |
| Apache | 0.0 /100 | #323 | Tragic 14.9% |
| Chippewa | 0.0 /100 | #324 | Tragic 15.0% |
| Arapaho | 0.0 /100 | #325 | Tragic 15.1% |
| Natives/Alaskans | 0.0 /100 | #326 | Tragic 15.3% |
| Pueblo | 0.0 /100 | #327 | Tragic 15.3% |
Demographics Similar to Immigrants from Turkey by Disability Age 35 to 64
In terms of disability age 35 to 64, the demographic groups most similar to Immigrants from Turkey are Egyptian (9.7%, a difference of 0.070%), Immigrants from Cuba (9.7%, a difference of 0.080%), Bulgarian (9.7%, a difference of 0.11%), Immigrants from Australia (9.7%, a difference of 0.22%), and Immigrants from Belarus (9.7%, a difference of 0.24%).
| Demographics | Rating | Rank | Disability Age 35 to 64 |
| Immigrants | Japan | 100.0 /100 | #30 | Exceptional 9.5% |
| Immigrants | Lithuania | 99.9 /100 | #31 | Exceptional 9.6% |
| Turks | 99.9 /100 | #32 | Exceptional 9.7% |
| Immigrants | Indonesia | 99.9 /100 | #33 | Exceptional 9.7% |
| Immigrants | Australia | 99.9 /100 | #34 | Exceptional 9.7% |
| Bulgarians | 99.9 /100 | #35 | Exceptional 9.7% |
| Immigrants | Cuba | 99.9 /100 | #36 | Exceptional 9.7% |
| Immigrants | Turkey | 99.9 /100 | #37 | Exceptional 9.7% |
| Egyptians | 99.9 /100 | #38 | Exceptional 9.7% |
| Immigrants | Belarus | 99.9 /100 | #39 | Exceptional 9.7% |
| Immigrants | Armenia | 99.9 /100 | #40 | Exceptional 9.7% |
| Israelis | 99.9 /100 | #41 | Exceptional 9.7% |
| Immigrants | Malaysia | 99.9 /100 | #42 | Exceptional 9.7% |
| Immigrants | Colombia | 99.9 /100 | #43 | Exceptional 9.8% |
| Immigrants | Egypt | 99.9 /100 | #44 | Exceptional 9.8% |