Black/African American vs Immigrants from Turkey 2nd Grade

COMPARE

Black/African American
Race
Ancestry
AfghanAfricanAlaska NativeAlaskan AthabascanAlbanianAleutAlsatianAmericanApacheArabArapahoArgentineanArmenianAssyrian/Chaldean/SyriacAustralianAustrianBahamianBangladeshiBarbadianBasqueBelgianBelizeanBermudanBhutaneseBlackfeetBolivianBrazilianBritishBritish West IndianBulgarianBurmeseCajunCambodianCanadianCape VerdeanCarpatho RusynCelticCentral AmericanCentral American IndianCherokeeCheyenneChickasawChileanChineseChippewaChoctawColombianColvilleComancheCosta RicanCreeCreekCroatianCrowCubanCypriotCzechCzechoslovakianDanishDelawareDominicanDutchDutch West IndianEastern EuropeanEcuadorianEgyptianEnglishEstonianEthiopianEuropeanFijianFilipinoFinnishFrenchFrench American IndianFrench CanadianGermanGerman RussianGhanaianGreekGuamanian/ChamorroGuatemalanGuyaneseHaitianHmongHonduranHopiHoumaHungarianIcelanderIndian (Asian)IndonesianInupiatIranianIraqiIrishIroquoisIsraeliItalianJamaicanJapaneseJordanianKenyanKiowaKoreanLaotianLatvianLebaneseLiberianLithuanianLumbeeLuxembourgerMacedonianMalaysianMalteseMarshalleseMenomineeMexicanMexican American IndianMongolianMoroccanNative HawaiianNavajoNepaleseNew ZealanderNicaraguanNigerianNorthern EuropeanNorwegianOkinawanOsageOttawaPaiutePakistaniPalestinianPanamanianParaguayanPennsylvania GermanPeruvianPimaPolishPortuguesePotawatomiPuebloPuerto RicanPuget Sound SalishRomanianRussianSalvadoranSamoanScandinavianScotch-IrishScottishSeminoleSenegaleseSerbianShoshoneSierra LeoneanSiouxSlavicSlovakSloveneSomaliSouth AfricanSouth AmericanSouth American IndianSoviet UnionSpaniardSpanishSpanish AmericanSpanish American IndianSri LankanSubsaharan AfricanSudaneseSwedishSwissSyrianTaiwaneseThaiTlingit-HaidaTohono O'OdhamTonganTrinidadian and TobagonianTsimshianTurkishU.S. Virgin IslanderUgandanUkrainianUruguayanUteVenezuelanVietnameseWelshWest IndianYakamaYaquiYugoslavianYumanYup'ikZimbabwean
Immigration
NonimmigrantsImmigrantsAfghanistanAfricaAlbaniaArgentinaArmeniaAsiaAustraliaAustriaBahamasBangladeshBarbadosBelarusBelgiumBelizeBoliviaBosnia and HerzegovinaBrazilBulgariaBurma/MyanmarCabo VerdeCambodiaCameroonCanadaCaribbeanCentral AmericaChileChinaColombiaCongoCosta RicaCroatiaCubaCzechoslovakiaDenmarkDominicaDominican RepublicEastern AfricaEastern AsiaEastern EuropeEcuadorEgyptEl SalvadorEnglandEritreaEthiopiaEuropeFijiFranceGermanyGhanaGreeceGrenadaGuatemalaGuyanaHaitiHondurasHong KongHungaryIndiaIndonesiaIranIraqIrelandIsraelItalyJamaicaJapanJordanKazakhstanKenyaKoreaKuwaitLaosLatin AmericaLatviaLebanonLiberiaLithuaniaMalaysiaMexicoMicronesiaMiddle AfricaMoldovaMoroccoNepalNetherlandsNicaraguaNigeriaNorth AmericaNorth MacedoniaNorthern AfricaNorthern EuropeNorwayOceaniaPakistanPanamaPeruPhilippinesPolandPortugalRomaniaRussiaSaudi ArabiaScotlandSenegalSerbiaSierra LeoneSingaporeSomaliaSouth AfricaSouth AmericaSouth Central AsiaSouth Eastern AsiaSouthern EuropeSpainSri LankaSt. Vincent and the GrenadinesSudanSwedenSwitzerlandSyriaTaiwanThailandTrinidad and TobagoUgandaUkraineUruguayUzbekistanVenezuelaVietnamWest IndiesWestern AfricaWestern AsiaWestern EuropeYemenZaireZimbabweAzores
Immigrants from Turkey
Race
Ancestry
AfghanAfricanAlaska NativeAlaskan AthabascanAlbanianAleutAlsatianAmericanApacheArabArapahoArgentineanArmenianAssyrian/Chaldean/SyriacAustralianAustrianBahamianBangladeshiBarbadianBasqueBelgianBelizeanBermudanBhutaneseBlackfeetBolivianBrazilianBritishBritish West IndianBulgarianBurmeseCajunCambodianCanadianCape VerdeanCarpatho RusynCelticCentral AmericanCentral American IndianCherokeeCheyenneChickasawChileanChineseChippewaChoctawColombianColvilleComancheCosta RicanCreeCreekCroatianCrowCubanCypriotCzechCzechoslovakianDanishDelawareDominicanDutchDutch West IndianEastern EuropeanEcuadorianEgyptianEnglishEstonianEthiopianEuropeanFijianFilipinoFinnishFrenchFrench American IndianFrench CanadianGermanGerman RussianGhanaianGreekGuamanian/ChamorroGuatemalanGuyaneseHaitianHmongHonduranHopiHoumaHungarianIcelanderIndian (Asian)IndonesianInupiatIranianIraqiIrishIroquoisIsraeliItalianJamaicanJapaneseJordanianKenyanKiowaKoreanLaotianLatvianLebaneseLiberianLithuanianLumbeeLuxembourgerMacedonianMalaysianMalteseMarshalleseMenomineeMexicanMexican American IndianMongolianMoroccanNative HawaiianNavajoNepaleseNew ZealanderNicaraguanNigerianNorthern EuropeanNorwegianOkinawanOsageOttawaPaiutePakistaniPalestinianPanamanianParaguayanPennsylvania GermanPeruvianPimaPolishPortuguesePotawatomiPuebloPuerto RicanPuget Sound SalishRomanianRussianSalvadoranSamoanScandinavianScotch-IrishScottishSeminoleSenegaleseSerbianShoshoneSierra LeoneanSiouxSlavicSlovakSloveneSomaliSouth AfricanSouth AmericanSouth American IndianSoviet UnionSpaniardSpanishSpanish AmericanSpanish American IndianSri LankanSubsaharan AfricanSudaneseSwedishSwissSyrianTaiwaneseThaiTlingit-HaidaTohono O'OdhamTonganTrinidadian and TobagonianTsimshianTurkishU.S. Virgin IslanderUgandanUkrainianUruguayanUteVenezuelanVietnameseWelshWest IndianYakamaYaquiYugoslavianYumanYup'ikZimbabwean
Immigration
NonimmigrantsImmigrantsAfghanistanAfricaAlbaniaArgentinaArmeniaAsiaAustraliaAustriaBahamasBangladeshBarbadosBelarusBelgiumBelizeBoliviaBosnia and HerzegovinaBrazilBulgariaBurma/MyanmarCabo VerdeCambodiaCameroonCanadaCaribbeanCentral AmericaChileChinaColombiaCongoCosta RicaCroatiaCubaCzechoslovakiaDenmarkDominicaDominican RepublicEastern AfricaEastern AsiaEastern EuropeEcuadorEgyptEl SalvadorEnglandEritreaEthiopiaEuropeFijiFranceGermanyGhanaGreeceGrenadaGuatemalaGuyanaHaitiHondurasHong KongHungaryIndiaIndonesiaIranIraqIrelandIsraelItalyJamaicaJapanJordanKazakhstanKenyaKoreaKuwaitLaosLatin AmericaLatviaLebanonLiberiaLithuaniaMalaysiaMexicoMicronesiaMiddle AfricaMoldovaMoroccoNepalNetherlandsNicaraguaNigeriaNorth AmericaNorth MacedoniaNorthern AfricaNorthern EuropeNorwayOceaniaPakistanPanamaPeruPhilippinesPolandPortugalRomaniaRussiaSaudi ArabiaScotlandSenegalSerbiaSierra LeoneSingaporeSomaliaSouth AfricaSouth AmericaSouth Central AsiaSouth Eastern AsiaSouthern EuropeSpainSri LankaSt. Vincent and the GrenadinesSudanSwedenSwitzerlandSyriaTaiwanThailandTrinidad and TobagoTurkeyUgandaUkraineUruguayUzbekistanVenezuelaVietnamWest IndiesWestern AfricaWestern AsiaWestern EuropeYemenZaireZimbabweAzores
2nd Grade
Income
Poverty
Unemployment
Labor Participation
Family Structure
Vehicle Availability
Education Level
Disability

2nd Grade Comparison

Blacks/African Americans

Immigrants from Turkey

Fair
Excellent
97.8%
2ND GRADE
29.9/ 100
METRIC RATING
192nd/ 347
METRIC RANK
98.0%
2ND GRADE
83.0/ 100
METRIC RATING
141st/ 347
METRIC RANK

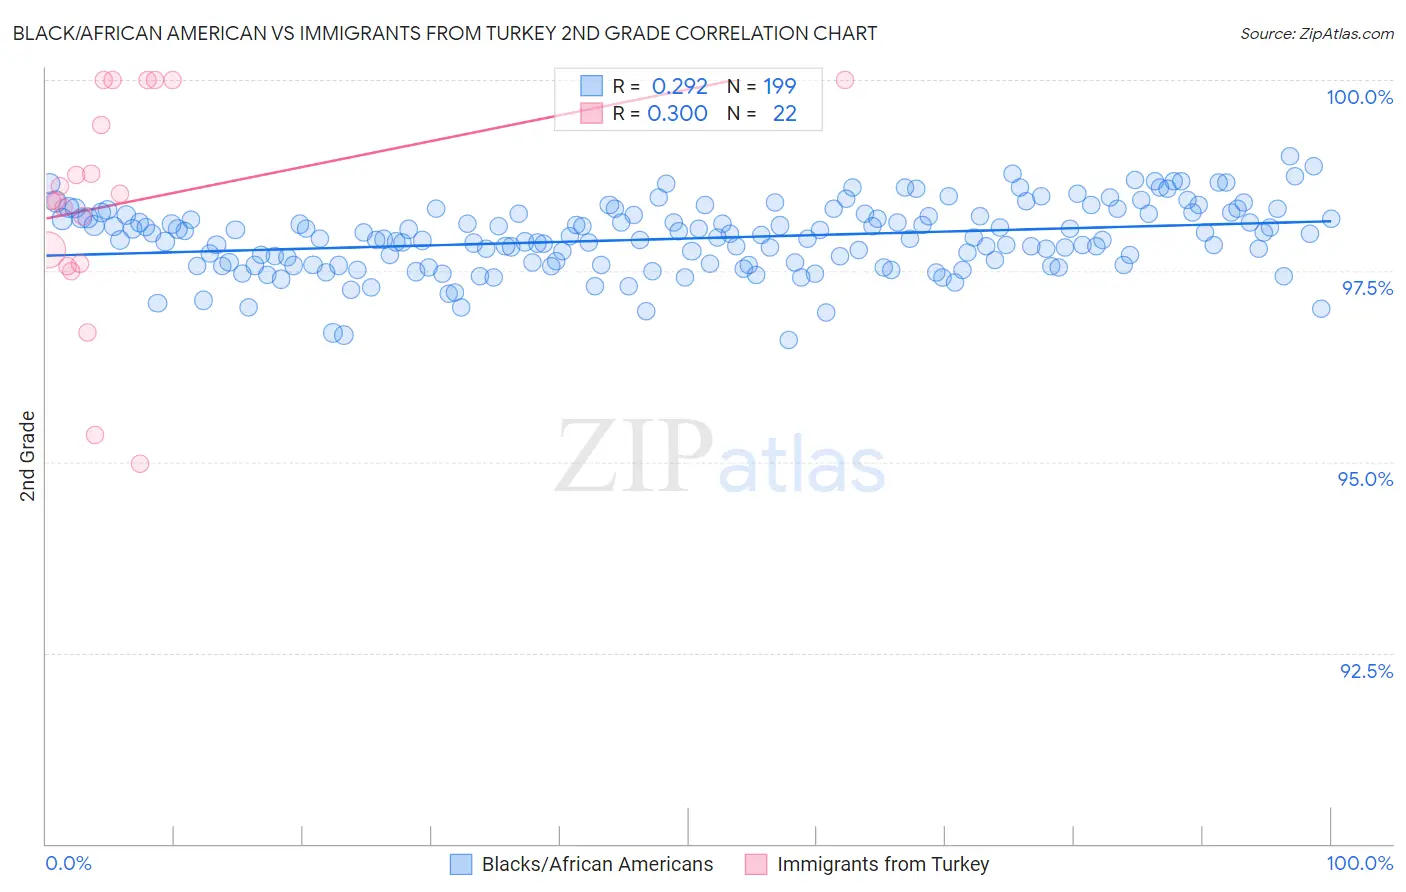
Black/African American vs Immigrants from Turkey 2nd Grade Correlation Chart

The statistical analysis conducted on geographies consisting of 566,043,750 people shows a weak positive correlation between the proportion of Blacks/African Americans and percentage of population with at least 2nd grade education in the United States with a correlation coefficient (R) of 0.292 and weighted average of 97.8%. Similarly, the statistical analysis conducted on geographies consisting of 223,057,877 people shows a mild positive correlation between the proportion of Immigrants from Turkey and percentage of population with at least 2nd grade education in the United States with a correlation coefficient (R) of 0.300 and weighted average of 98.0%, a difference of 0.19%.
Black/African American vs Immigrants from Turkey 2nd Grade

2nd Grade Correlation Summary

MeasurementBlack/African AmericanImmigrants from Turkey
Minimum96.6%95.0%
Maximum99.0%100.0%
Range2.4%5.0%
Mean97.9%98.4%
Median97.9%98.5%
Interquartile 25% (IQ1)97.6%97.6%
Interquartile 75% (IQ3)98.2%100.0%
Interquartile Range (IQR)0.66%2.4%
Standard Deviation (Sample)0.44%1.4%
Standard Deviation (Population)0.44%1.4%

Similar Demographics by 2nd Grade

Demographics Similar to Blacks/African Americans by 2nd Grade

In terms of 2nd grade, the demographic groups most similar to Blacks/African Americans are Paraguayan (97.8%, a difference of 0.0%), Panamanian (97.8%, a difference of 0.010%), Immigrants from Taiwan (97.8%, a difference of 0.010%), Hawaiian (97.8%, a difference of 0.010%), and Paiute (97.8%, a difference of 0.010%).
DemographicsRating | Rank2nd Grade
Immigrants | Argentina
40.6
/100
|
#185
Average
97.8%
Arabs
36.9
/100
|
#186
Fair
97.8%
Pakistanis
36.1
/100
|
#187
Fair
97.8%
Immigrants | Kazakhstan
35.6
/100
|
#188
Fair
97.8%
Panamanians
33.5
/100
|
#189
Fair
97.8%
Immigrants | Taiwan
31.8
/100
|
#190
Fair
97.8%
Paraguayans
30.8
/100
|
#191
Fair
97.8%
Blacks/African Americans
29.9
/100
|
#192
Fair
97.8%
Hawaiians
28.5
/100
|
#193
Fair
97.8%
Paiute
27.0
/100
|
#194
Fair
97.8%
Mongolians
26.7
/100
|
#195
Fair
97.8%
Immigrants | Kenya
26.4
/100
|
#196
Fair
97.8%
Immigrants | Uganda
26.3
/100
|
#197
Fair
97.8%
Guamanians/Chamorros
25.7
/100
|
#198
Fair
97.8%
Immigrants | Egypt
24.4
/100
|
#199
Fair
97.8%

Demographics Similar to Immigrants from Turkey by 2nd Grade

In terms of 2nd grade, the demographic groups most similar to Immigrants from Turkey are Palestinian (98.0%, a difference of 0.010%), Burmese (98.0%, a difference of 0.010%), Alsatian (98.0%, a difference of 0.010%), Hmong (98.0%, a difference of 0.020%), and Filipino (98.0%, a difference of 0.020%).
DemographicsRating | Rank2nd Grade
Immigrants | Hungary
89.7
/100
|
#134
Excellent
98.0%
Immigrants | Bulgaria
89.7
/100
|
#135
Excellent
98.0%
Immigrants | Kuwait
89.2
/100
|
#136
Excellent
98.0%
Immigrants | Romania
88.3
/100
|
#137
Excellent
98.0%
Israelis
87.9
/100
|
#138
Excellent
98.0%
Blackfeet
87.5
/100
|
#139
Excellent
98.0%
Palestinians
83.9
/100
|
#140
Excellent
98.0%
Immigrants | Turkey
83.0
/100
|
#141
Excellent
98.0%
Burmese
81.0
/100
|
#142
Excellent
98.0%
Alsatians
80.5
/100
|
#143
Excellent
98.0%
Hmong
80.0
/100
|
#144
Good
98.0%
Filipinos
79.2
/100
|
#145
Good
98.0%
Immigrants | Israel
78.0
/100
|
#146
Good
98.0%
Immigrants | Greece
76.8
/100
|
#147
Good
98.0%
Jordanians
74.5
/100
|
#148
Good
98.0%