Bermudan vs Albanian Cognitive Disability
COMPARE
Bermudan
Albanian
Cognitive Disability
Cognitive Disability Comparison
Bermudans
Albanians
18.1%
COGNITIVE DISABILITY
0.1/ 100
METRIC RATING
285th/ 347
METRIC RANK
16.8%
COGNITIVE DISABILITY
97.3/ 100
METRIC RATING
109th/ 347
METRIC RANK
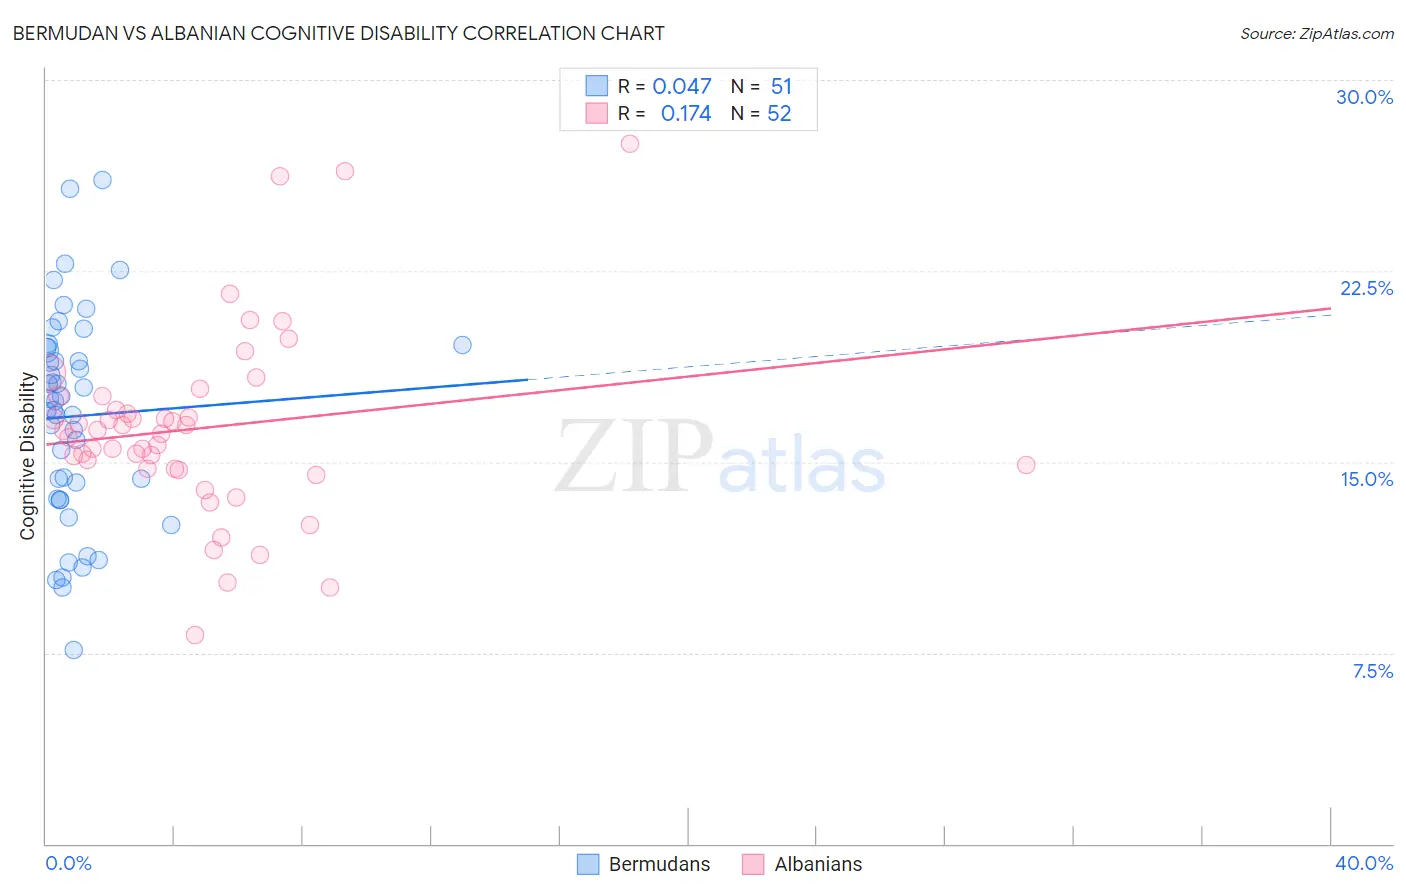
Bermudan vs Albanian Cognitive Disability Correlation Chart
The statistical analysis conducted on geographies consisting of 55,721,081 people shows no correlation between the proportion of Bermudans and percentage of population with cognitive disability in the United States with a correlation coefficient (R) of 0.047 and weighted average of 18.1%. Similarly, the statistical analysis conducted on geographies consisting of 193,265,298 people shows a poor positive correlation between the proportion of Albanians and percentage of population with cognitive disability in the United States with a correlation coefficient (R) of 0.174 and weighted average of 16.8%, a difference of 7.6%.
Cognitive Disability Correlation Summary
| Measurement | Bermudan | Albanian |
| Minimum | 7.6% | 8.2% |
| Maximum | 26.1% | 27.5% |
| Range | 18.5% | 19.3% |
| Mean | 16.8% | 16.3% |
| Median | 17.4% | 16.2% |
| Interquartile 25% (IQ1) | 13.6% | 14.7% |
| Interquartile 75% (IQ3) | 19.5% | 17.3% |
| Interquartile Range (IQR) | 5.9% | 2.6% |
| Standard Deviation (Sample) | 4.1% | 3.7% |
| Standard Deviation (Population) | 4.0% | 3.6% |
Similar Demographics by Cognitive Disability
Demographics Similar to Bermudans by Cognitive Disability
In terms of cognitive disability, the demographic groups most similar to Bermudans are Immigrants from Uganda (18.1%, a difference of 0.010%), Kenyan (18.1%, a difference of 0.040%), Nigerian (18.1%, a difference of 0.050%), Immigrants from Cambodia (18.1%, a difference of 0.080%), and Dutch West Indian (18.1%, a difference of 0.080%).
| Demographics | Rating | Rank | Cognitive Disability |
| Immigrants | Micronesia | 0.2 /100 | #278 | Tragic 18.1% |
| Chippewa | 0.1 /100 | #279 | Tragic 18.1% |
| West Indians | 0.1 /100 | #280 | Tragic 18.1% |
| Yakama | 0.1 /100 | #281 | Tragic 18.1% |
| Immigrants | Cambodia | 0.1 /100 | #282 | Tragic 18.1% |
| Nigerians | 0.1 /100 | #283 | Tragic 18.1% |
| Immigrants | Uganda | 0.1 /100 | #284 | Tragic 18.1% |
| Bermudans | 0.1 /100 | #285 | Tragic 18.1% |
| Kenyans | 0.1 /100 | #286 | Tragic 18.1% |
| Dutch West Indians | 0.1 /100 | #287 | Tragic 18.1% |
| Immigrants | West Indies | 0.1 /100 | #288 | Tragic 18.1% |
| Natives/Alaskans | 0.1 /100 | #289 | Tragic 18.1% |
| Immigrants | Africa | 0.1 /100 | #290 | Tragic 18.1% |
| Ottawa | 0.1 /100 | #291 | Tragic 18.2% |
| Iroquois | 0.1 /100 | #292 | Tragic 18.2% |
Demographics Similar to Albanians by Cognitive Disability
In terms of cognitive disability, the demographic groups most similar to Albanians are Arapaho (16.8%, a difference of 0.010%), Uruguayan (16.8%, a difference of 0.020%), Indian (Asian) (16.8%, a difference of 0.040%), Canadian (16.8%, a difference of 0.050%), and Immigrants from Sri Lanka (16.8%, a difference of 0.050%).
| Demographics | Rating | Rank | Cognitive Disability |
| Irish | 98.1 /100 | #102 | Exceptional 16.8% |
| Paraguayans | 98.0 /100 | #103 | Exceptional 16.8% |
| Palestinians | 98.0 /100 | #104 | Exceptional 16.8% |
| Immigrants | Eastern Asia | 97.9 /100 | #105 | Exceptional 16.8% |
| Northern Europeans | 97.8 /100 | #106 | Exceptional 16.8% |
| Immigrants | Nicaragua | 97.8 /100 | #107 | Exceptional 16.8% |
| Canadians | 97.5 /100 | #108 | Exceptional 16.8% |
| Albanians | 97.3 /100 | #109 | Exceptional 16.8% |
| Arapaho | 97.3 /100 | #110 | Exceptional 16.8% |
| Uruguayans | 97.2 /100 | #111 | Exceptional 16.8% |
| Indians (Asian) | 97.2 /100 | #112 | Exceptional 16.8% |
| Immigrants | Sri Lanka | 97.1 /100 | #113 | Exceptional 16.8% |
| Koreans | 97.1 /100 | #114 | Exceptional 16.8% |
| Yup'ik | 96.9 /100 | #115 | Exceptional 16.9% |
| Inupiat | 96.5 /100 | #116 | Exceptional 16.9% |