Bermudan vs Luxembourger Cognitive Disability
COMPARE
Bermudan
Luxembourger
Cognitive Disability
Cognitive Disability Comparison
Bermudans
Luxembourgers
18.1%
COGNITIVE DISABILITY
0.1/ 100
METRIC RATING
285th/ 347
METRIC RANK
16.4%
COGNITIVE DISABILITY
99.9/ 100
METRIC RATING
25th/ 347
METRIC RANK
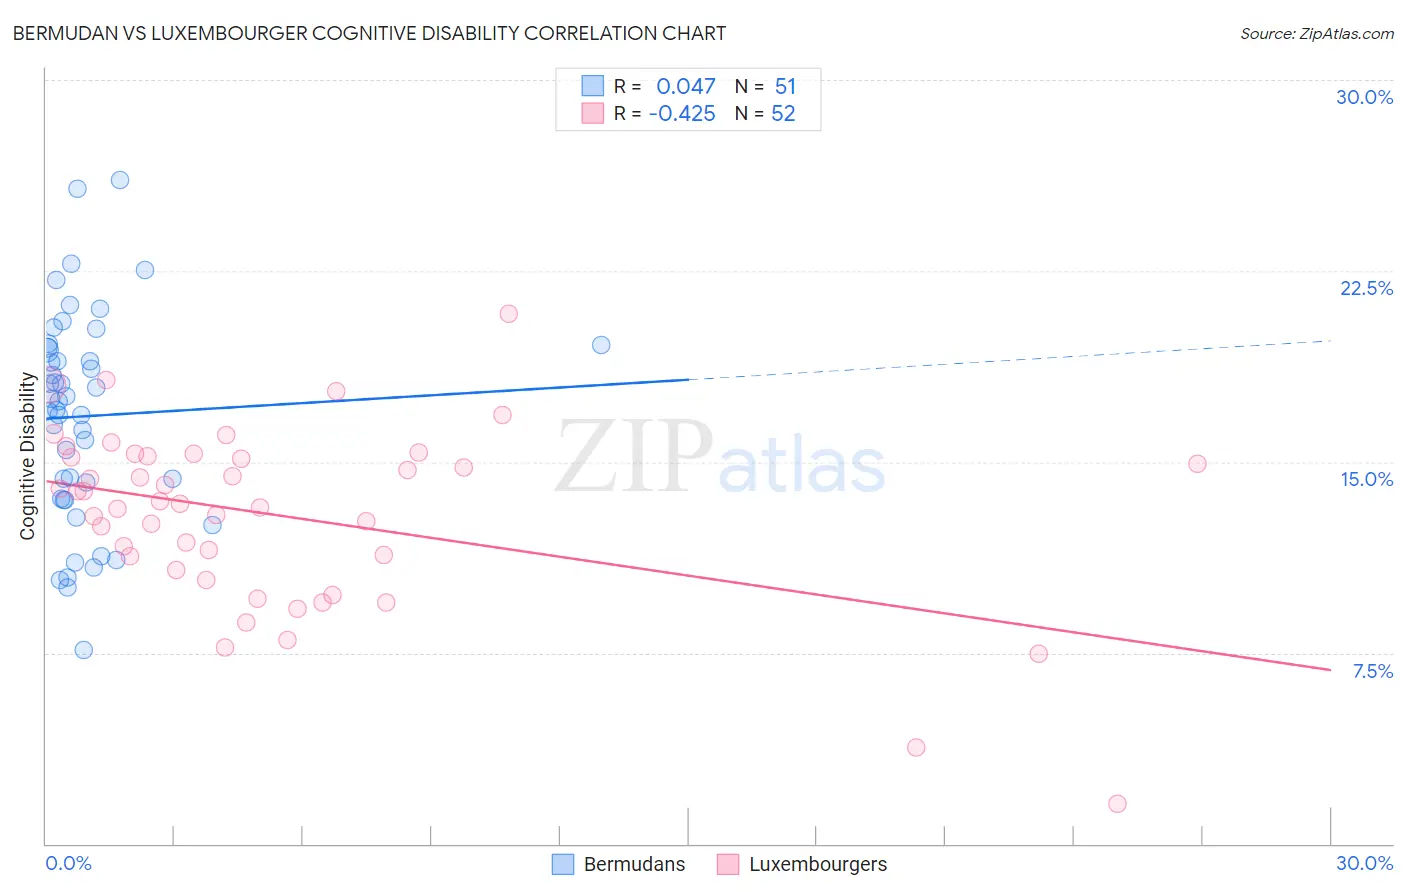
Bermudan vs Luxembourger Cognitive Disability Correlation Chart
The statistical analysis conducted on geographies consisting of 55,721,081 people shows no correlation between the proportion of Bermudans and percentage of population with cognitive disability in the United States with a correlation coefficient (R) of 0.047 and weighted average of 18.1%. Similarly, the statistical analysis conducted on geographies consisting of 144,680,571 people shows a moderate negative correlation between the proportion of Luxembourgers and percentage of population with cognitive disability in the United States with a correlation coefficient (R) of -0.425 and weighted average of 16.4%, a difference of 10.7%.
Cognitive Disability Correlation Summary
| Measurement | Bermudan | Luxembourger |
| Minimum | 7.6% | 1.6% |
| Maximum | 26.1% | 20.8% |
| Range | 18.5% | 19.3% |
| Mean | 16.8% | 12.9% |
| Median | 17.4% | 13.4% |
| Interquartile 25% (IQ1) | 13.6% | 11.0% |
| Interquartile 75% (IQ3) | 19.5% | 15.2% |
| Interquartile Range (IQR) | 5.9% | 4.2% |
| Standard Deviation (Sample) | 4.1% | 3.5% |
| Standard Deviation (Population) | 4.0% | 3.5% |
Similar Demographics by Cognitive Disability
Demographics Similar to Bermudans by Cognitive Disability
In terms of cognitive disability, the demographic groups most similar to Bermudans are Immigrants from Uganda (18.1%, a difference of 0.010%), Kenyan (18.1%, a difference of 0.040%), Nigerian (18.1%, a difference of 0.050%), Immigrants from Cambodia (18.1%, a difference of 0.080%), and Dutch West Indian (18.1%, a difference of 0.080%).
| Demographics | Rating | Rank | Cognitive Disability |
| Immigrants | Micronesia | 0.2 /100 | #278 | Tragic 18.1% |
| Chippewa | 0.1 /100 | #279 | Tragic 18.1% |
| West Indians | 0.1 /100 | #280 | Tragic 18.1% |
| Yakama | 0.1 /100 | #281 | Tragic 18.1% |
| Immigrants | Cambodia | 0.1 /100 | #282 | Tragic 18.1% |
| Nigerians | 0.1 /100 | #283 | Tragic 18.1% |
| Immigrants | Uganda | 0.1 /100 | #284 | Tragic 18.1% |
| Bermudans | 0.1 /100 | #285 | Tragic 18.1% |
| Kenyans | 0.1 /100 | #286 | Tragic 18.1% |
| Dutch West Indians | 0.1 /100 | #287 | Tragic 18.1% |
| Immigrants | West Indies | 0.1 /100 | #288 | Tragic 18.1% |
| Natives/Alaskans | 0.1 /100 | #289 | Tragic 18.1% |
| Immigrants | Africa | 0.1 /100 | #290 | Tragic 18.1% |
| Ottawa | 0.1 /100 | #291 | Tragic 18.2% |
| Iroquois | 0.1 /100 | #292 | Tragic 18.2% |
Demographics Similar to Luxembourgers by Cognitive Disability
In terms of cognitive disability, the demographic groups most similar to Luxembourgers are Immigrants from Croatia (16.4%, a difference of 0.030%), Immigrants from Argentina (16.4%, a difference of 0.040%), Immigrants from Pakistan (16.4%, a difference of 0.050%), Polish (16.4%, a difference of 0.050%), and Croatian (16.4%, a difference of 0.060%).
| Demographics | Rating | Rank | Cognitive Disability |
| Immigrants | Northern Europe | 100.0 /100 | #18 | Exceptional 16.3% |
| Immigrants | Bolivia | 100.0 /100 | #19 | Exceptional 16.3% |
| Bulgarians | 100.0 /100 | #20 | Exceptional 16.3% |
| Immigrants | Cuba | 100.0 /100 | #21 | Exceptional 16.3% |
| Immigrants | South Central Asia | 99.9 /100 | #22 | Exceptional 16.4% |
| Croatians | 99.9 /100 | #23 | Exceptional 16.4% |
| Immigrants | Argentina | 99.9 /100 | #24 | Exceptional 16.4% |
| Luxembourgers | 99.9 /100 | #25 | Exceptional 16.4% |
| Immigrants | Croatia | 99.9 /100 | #26 | Exceptional 16.4% |
| Immigrants | Pakistan | 99.9 /100 | #27 | Exceptional 16.4% |
| Poles | 99.9 /100 | #28 | Exceptional 16.4% |
| Filipinos | 99.9 /100 | #29 | Exceptional 16.4% |
| Czechs | 99.9 /100 | #30 | Exceptional 16.4% |
| Immigrants | Romania | 99.9 /100 | #31 | Exceptional 16.4% |
| Immigrants | Israel | 99.9 /100 | #32 | Exceptional 16.4% |