Malaysian vs Albanian Cognitive Disability
COMPARE
Malaysian
Albanian
Cognitive Disability
Cognitive Disability Comparison
Malaysians
Albanians
17.9%
COGNITIVE DISABILITY
0.6/ 100
METRIC RATING
251st/ 347
METRIC RANK
16.8%
COGNITIVE DISABILITY
97.3/ 100
METRIC RATING
109th/ 347
METRIC RANK
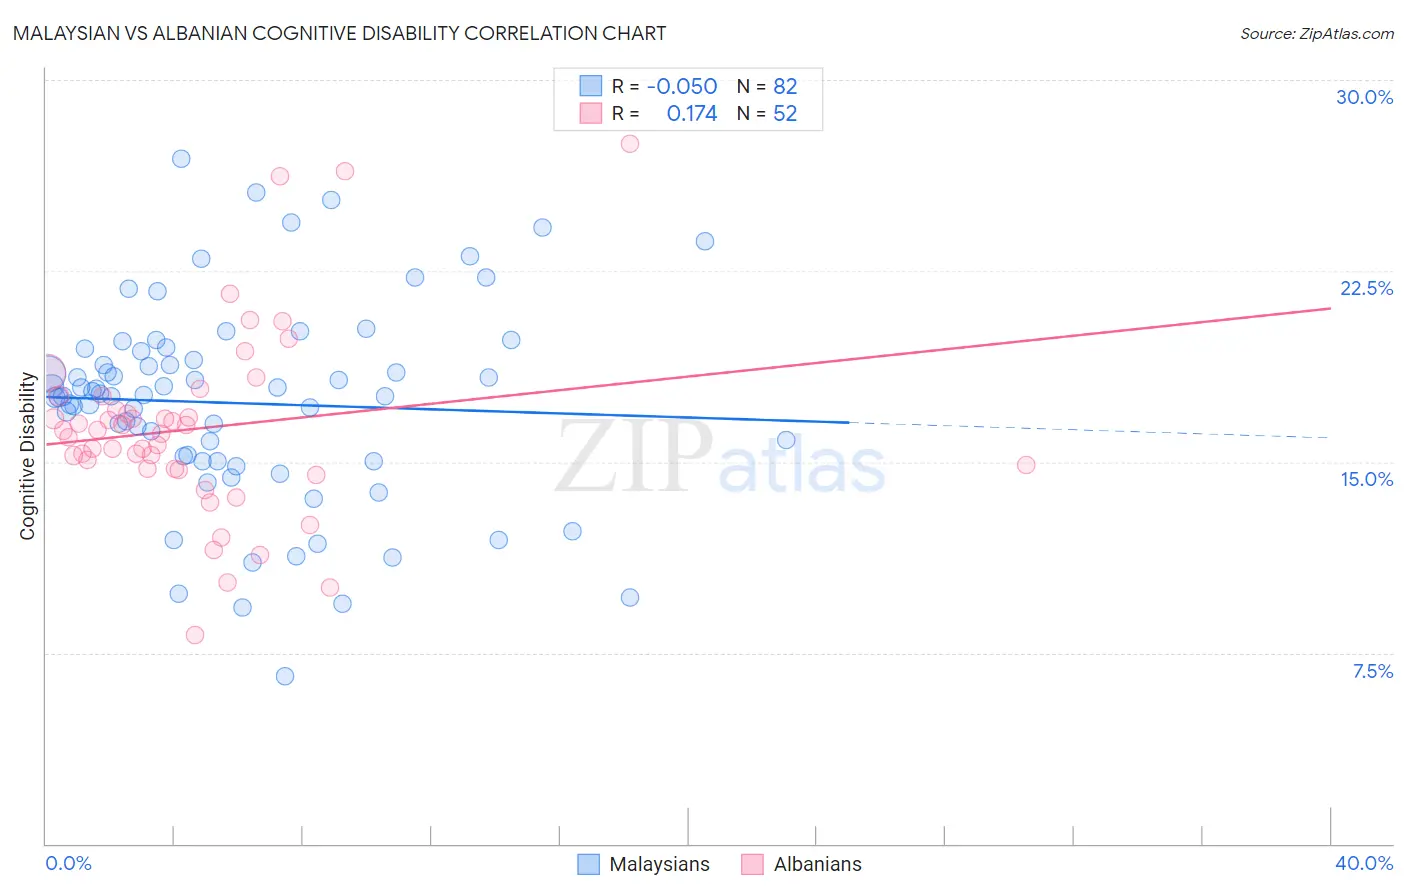
Malaysian vs Albanian Cognitive Disability Correlation Chart
The statistical analysis conducted on geographies consisting of 226,070,316 people shows a slight negative correlation between the proportion of Malaysians and percentage of population with cognitive disability in the United States with a correlation coefficient (R) of -0.050 and weighted average of 17.9%. Similarly, the statistical analysis conducted on geographies consisting of 193,265,298 people shows a poor positive correlation between the proportion of Albanians and percentage of population with cognitive disability in the United States with a correlation coefficient (R) of 0.174 and weighted average of 16.8%, a difference of 6.3%.
Cognitive Disability Correlation Summary
| Measurement | Malaysian | Albanian |
| Minimum | 6.6% | 8.2% |
| Maximum | 26.9% | 27.5% |
| Range | 20.3% | 19.3% |
| Mean | 17.3% | 16.3% |
| Median | 17.6% | 16.2% |
| Interquartile 25% (IQ1) | 15.0% | 14.7% |
| Interquartile 75% (IQ3) | 19.3% | 17.3% |
| Interquartile Range (IQR) | 4.3% | 2.6% |
| Standard Deviation (Sample) | 4.0% | 3.7% |
| Standard Deviation (Population) | 3.9% | 3.6% |
Similar Demographics by Cognitive Disability
Demographics Similar to Malaysians by Cognitive Disability
In terms of cognitive disability, the demographic groups most similar to Malaysians are Cree (17.9%, a difference of 0.010%), Immigrants from Ethiopia (17.9%, a difference of 0.010%), Immigrants from Grenada (17.9%, a difference of 0.010%), Hopi (17.9%, a difference of 0.030%), and Hispanic or Latino (17.9%, a difference of 0.030%).
| Demographics | Rating | Rank | Cognitive Disability |
| Jamaicans | 0.9 /100 | #244 | Tragic 17.9% |
| Trinidadians and Tobagonians | 0.8 /100 | #245 | Tragic 17.9% |
| Immigrants | Thailand | 0.8 /100 | #246 | Tragic 17.9% |
| Samoans | 0.7 /100 | #247 | Tragic 17.9% |
| French American Indians | 0.7 /100 | #248 | Tragic 17.9% |
| Cree | 0.7 /100 | #249 | Tragic 17.9% |
| Immigrants | Ethiopia | 0.7 /100 | #250 | Tragic 17.9% |
| Malaysians | 0.6 /100 | #251 | Tragic 17.9% |
| Immigrants | Grenada | 0.6 /100 | #252 | Tragic 17.9% |
| Hopi | 0.6 /100 | #253 | Tragic 17.9% |
| Hispanics or Latinos | 0.6 /100 | #254 | Tragic 17.9% |
| Immigrants | Azores | 0.6 /100 | #255 | Tragic 17.9% |
| Bahamians | 0.6 /100 | #256 | Tragic 17.9% |
| Mexican American Indians | 0.6 /100 | #257 | Tragic 17.9% |
| Immigrants | Armenia | 0.6 /100 | #258 | Tragic 17.9% |
Demographics Similar to Albanians by Cognitive Disability
In terms of cognitive disability, the demographic groups most similar to Albanians are Arapaho (16.8%, a difference of 0.010%), Uruguayan (16.8%, a difference of 0.020%), Indian (Asian) (16.8%, a difference of 0.040%), Canadian (16.8%, a difference of 0.050%), and Immigrants from Sri Lanka (16.8%, a difference of 0.050%).
| Demographics | Rating | Rank | Cognitive Disability |
| Irish | 98.1 /100 | #102 | Exceptional 16.8% |
| Paraguayans | 98.0 /100 | #103 | Exceptional 16.8% |
| Palestinians | 98.0 /100 | #104 | Exceptional 16.8% |
| Immigrants | Eastern Asia | 97.9 /100 | #105 | Exceptional 16.8% |
| Northern Europeans | 97.8 /100 | #106 | Exceptional 16.8% |
| Immigrants | Nicaragua | 97.8 /100 | #107 | Exceptional 16.8% |
| Canadians | 97.5 /100 | #108 | Exceptional 16.8% |
| Albanians | 97.3 /100 | #109 | Exceptional 16.8% |
| Arapaho | 97.3 /100 | #110 | Exceptional 16.8% |
| Uruguayans | 97.2 /100 | #111 | Exceptional 16.8% |
| Indians (Asian) | 97.2 /100 | #112 | Exceptional 16.8% |
| Immigrants | Sri Lanka | 97.1 /100 | #113 | Exceptional 16.8% |
| Koreans | 97.1 /100 | #114 | Exceptional 16.8% |
| Yup'ik | 96.9 /100 | #115 | Exceptional 16.9% |
| Inupiat | 96.5 /100 | #116 | Exceptional 16.9% |