Australian vs Immigrants from Singapore Ambulatory Disability
COMPARE
Australian
Immigrants from Singapore
Ambulatory Disability
Ambulatory Disability Comparison
Australians
Immigrants from Singapore
5.8%
AMBULATORY DISABILITY
98.8/ 100
METRIC RATING
90th/ 347
METRIC RANK
5.0%
AMBULATORY DISABILITY
100.0/ 100
METRIC RATING
5th/ 347
METRIC RANK
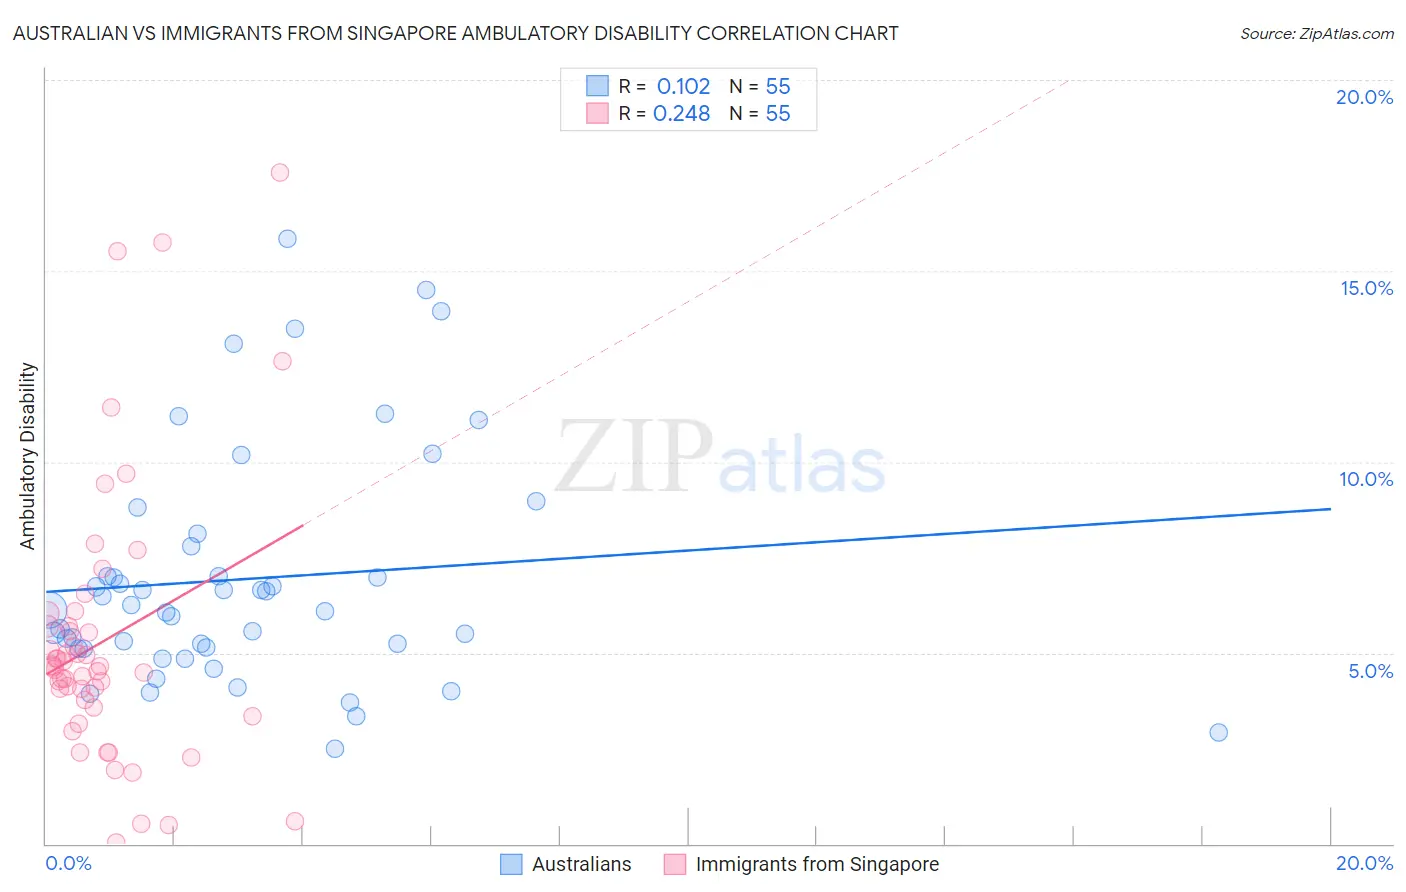
Australian vs Immigrants from Singapore Ambulatory Disability Correlation Chart
The statistical analysis conducted on geographies consisting of 224,102,055 people shows a poor positive correlation between the proportion of Australians and percentage of population with ambulatory disability in the United States with a correlation coefficient (R) of 0.102 and weighted average of 5.8%. Similarly, the statistical analysis conducted on geographies consisting of 137,492,636 people shows a weak positive correlation between the proportion of Immigrants from Singapore and percentage of population with ambulatory disability in the United States with a correlation coefficient (R) of 0.248 and weighted average of 5.0%, a difference of 15.1%.
Ambulatory Disability Correlation Summary
| Measurement | Australian | Immigrants from Singapore |
| Minimum | 2.5% | 0.042% |
| Maximum | 15.8% | 17.6% |
| Range | 13.3% | 17.5% |
| Mean | 6.9% | 5.3% |
| Median | 6.1% | 4.6% |
| Interquartile 25% (IQ1) | 5.1% | 3.6% |
| Interquartile 75% (IQ3) | 7.8% | 5.7% |
| Interquartile Range (IQR) | 2.7% | 2.1% |
| Standard Deviation (Sample) | 3.0% | 3.6% |
| Standard Deviation (Population) | 3.0% | 3.6% |
Similar Demographics by Ambulatory Disability
Demographics Similar to Australians by Ambulatory Disability
In terms of ambulatory disability, the demographic groups most similar to Australians are Bhutanese (5.8%, a difference of 0.0%), Immigrants from Sudan (5.8%, a difference of 0.0%), Soviet Union (5.8%, a difference of 0.12%), Immigrants from Chile (5.8%, a difference of 0.16%), and Immigrants from Sierra Leone (5.8%, a difference of 0.17%).
| Demographics | Rating | Rank | Ambulatory Disability |
| Eastern Europeans | 99.2 /100 | #83 | Exceptional 5.7% |
| Ugandans | 99.2 /100 | #84 | Exceptional 5.7% |
| South Americans | 99.0 /100 | #85 | Exceptional 5.7% |
| Latvians | 99.0 /100 | #86 | Exceptional 5.7% |
| Immigrants | Chile | 98.9 /100 | #87 | Exceptional 5.8% |
| Soviet Union | 98.9 /100 | #88 | Exceptional 5.8% |
| Bhutanese | 98.8 /100 | #89 | Exceptional 5.8% |
| Australians | 98.8 /100 | #90 | Exceptional 5.8% |
| Immigrants | Sudan | 98.8 /100 | #91 | Exceptional 5.8% |
| Immigrants | Sierra Leone | 98.6 /100 | #92 | Exceptional 5.8% |
| Immigrants | Denmark | 98.6 /100 | #93 | Exceptional 5.8% |
| Kenyans | 98.4 /100 | #94 | Exceptional 5.8% |
| Immigrants | El Salvador | 98.4 /100 | #95 | Exceptional 5.8% |
| Salvadorans | 98.4 /100 | #96 | Exceptional 5.8% |
| Immigrants | Somalia | 98.3 /100 | #97 | Exceptional 5.8% |
Demographics Similar to Immigrants from Singapore by Ambulatory Disability
In terms of ambulatory disability, the demographic groups most similar to Immigrants from Singapore are Immigrants from Bolivia (5.0%, a difference of 0.68%), Bolivian (5.1%, a difference of 1.1%), Immigrants from Taiwan (4.9%, a difference of 1.4%), Thai (4.9%, a difference of 1.6%), and Immigrants from South Central Asia (5.1%, a difference of 2.1%).
| Demographics | Rating | Rank | Ambulatory Disability |
| Immigrants | India | 100.0 /100 | #1 | Exceptional 4.8% |
| Filipinos | 100.0 /100 | #2 | Exceptional 4.9% |
| Thais | 100.0 /100 | #3 | Exceptional 4.9% |
| Immigrants | Taiwan | 100.0 /100 | #4 | Exceptional 4.9% |
| Immigrants | Singapore | 100.0 /100 | #5 | Exceptional 5.0% |
| Immigrants | Bolivia | 100.0 /100 | #6 | Exceptional 5.0% |
| Bolivians | 100.0 /100 | #7 | Exceptional 5.1% |
| Immigrants | South Central Asia | 100.0 /100 | #8 | Exceptional 5.1% |
| Iranians | 100.0 /100 | #9 | Exceptional 5.1% |
| Yup'ik | 100.0 /100 | #10 | Exceptional 5.2% |
| Immigrants | Korea | 100.0 /100 | #11 | Exceptional 5.2% |
| Okinawans | 100.0 /100 | #12 | Exceptional 5.3% |
| Burmese | 100.0 /100 | #13 | Exceptional 5.3% |
| Immigrants | Eastern Asia | 100.0 /100 | #14 | Exceptional 5.3% |
| Immigrants | China | 100.0 /100 | #15 | Exceptional 5.3% |