Yaqui vs Immigrants from Singapore Ambulatory Disability
COMPARE
Yaqui
Immigrants from Singapore
Ambulatory Disability
Ambulatory Disability Comparison
Yaqui
Immigrants from Singapore
6.8%
AMBULATORY DISABILITY
0.0/ 100
METRIC RATING
281st/ 347
METRIC RANK
5.0%
AMBULATORY DISABILITY
100.0/ 100
METRIC RATING
5th/ 347
METRIC RANK
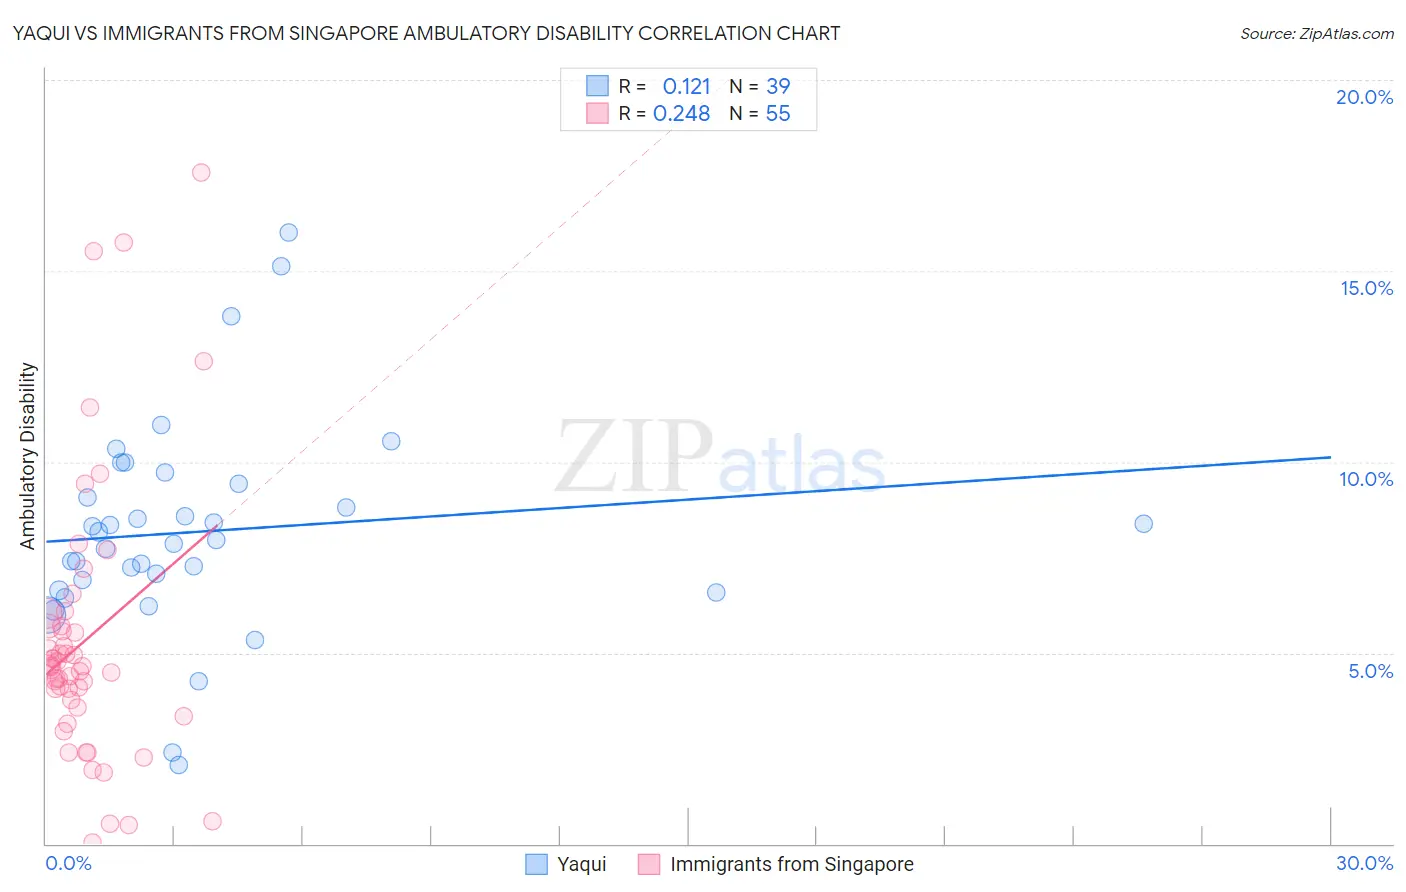
Yaqui vs Immigrants from Singapore Ambulatory Disability Correlation Chart
The statistical analysis conducted on geographies consisting of 107,720,926 people shows a poor positive correlation between the proportion of Yaqui and percentage of population with ambulatory disability in the United States with a correlation coefficient (R) of 0.121 and weighted average of 6.8%. Similarly, the statistical analysis conducted on geographies consisting of 137,492,636 people shows a weak positive correlation between the proportion of Immigrants from Singapore and percentage of population with ambulatory disability in the United States with a correlation coefficient (R) of 0.248 and weighted average of 5.0%, a difference of 35.0%.
Ambulatory Disability Correlation Summary
| Measurement | Yaqui | Immigrants from Singapore |
| Minimum | 2.1% | 0.042% |
| Maximum | 16.0% | 17.6% |
| Range | 13.9% | 17.5% |
| Mean | 8.2% | 5.3% |
| Median | 8.0% | 4.6% |
| Interquartile 25% (IQ1) | 6.6% | 3.6% |
| Interquartile 75% (IQ3) | 9.4% | 5.7% |
| Interquartile Range (IQR) | 2.8% | 2.1% |
| Standard Deviation (Sample) | 2.8% | 3.6% |
| Standard Deviation (Population) | 2.7% | 3.6% |
Similar Demographics by Ambulatory Disability
Demographics Similar to Yaqui by Ambulatory Disability
In terms of ambulatory disability, the demographic groups most similar to Yaqui are Pennsylvania German (6.8%, a difference of 0.070%), Barbadian (6.8%, a difference of 0.13%), Immigrants from Caribbean (6.7%, a difference of 0.17%), Immigrants from Barbados (6.8%, a difference of 0.28%), and Immigrants from Jamaica (6.8%, a difference of 0.35%).
| Demographics | Rating | Rank | Ambulatory Disability |
| Sioux | 0.1 /100 | #274 | Tragic 6.7% |
| Immigrants | Guyana | 0.1 /100 | #275 | Tragic 6.7% |
| Celtics | 0.1 /100 | #276 | Tragic 6.7% |
| Jamaicans | 0.1 /100 | #277 | Tragic 6.7% |
| Immigrants | West Indies | 0.1 /100 | #278 | Tragic 6.7% |
| Immigrants | Caribbean | 0.0 /100 | #279 | Tragic 6.7% |
| Pennsylvania Germans | 0.0 /100 | #280 | Tragic 6.8% |
| Yaqui | 0.0 /100 | #281 | Tragic 6.8% |
| Barbadians | 0.0 /100 | #282 | Tragic 6.8% |
| Immigrants | Barbados | 0.0 /100 | #283 | Tragic 6.8% |
| Immigrants | Jamaica | 0.0 /100 | #284 | Tragic 6.8% |
| Fijians | 0.0 /100 | #285 | Tragic 6.8% |
| Yakama | 0.0 /100 | #286 | Tragic 6.8% |
| U.S. Virgin Islanders | 0.0 /100 | #287 | Tragic 6.8% |
| Immigrants | Nonimmigrants | 0.0 /100 | #288 | Tragic 6.9% |
Demographics Similar to Immigrants from Singapore by Ambulatory Disability
In terms of ambulatory disability, the demographic groups most similar to Immigrants from Singapore are Immigrants from Bolivia (5.0%, a difference of 0.68%), Bolivian (5.1%, a difference of 1.1%), Immigrants from Taiwan (4.9%, a difference of 1.4%), Thai (4.9%, a difference of 1.6%), and Immigrants from South Central Asia (5.1%, a difference of 2.1%).
| Demographics | Rating | Rank | Ambulatory Disability |
| Immigrants | India | 100.0 /100 | #1 | Exceptional 4.8% |
| Filipinos | 100.0 /100 | #2 | Exceptional 4.9% |
| Thais | 100.0 /100 | #3 | Exceptional 4.9% |
| Immigrants | Taiwan | 100.0 /100 | #4 | Exceptional 4.9% |
| Immigrants | Singapore | 100.0 /100 | #5 | Exceptional 5.0% |
| Immigrants | Bolivia | 100.0 /100 | #6 | Exceptional 5.0% |
| Bolivians | 100.0 /100 | #7 | Exceptional 5.1% |
| Immigrants | South Central Asia | 100.0 /100 | #8 | Exceptional 5.1% |
| Iranians | 100.0 /100 | #9 | Exceptional 5.1% |
| Yup'ik | 100.0 /100 | #10 | Exceptional 5.2% |
| Immigrants | Korea | 100.0 /100 | #11 | Exceptional 5.2% |
| Okinawans | 100.0 /100 | #12 | Exceptional 5.3% |
| Burmese | 100.0 /100 | #13 | Exceptional 5.3% |
| Immigrants | Eastern Asia | 100.0 /100 | #14 | Exceptional 5.3% |
| Immigrants | China | 100.0 /100 | #15 | Exceptional 5.3% |