American vs Immigrants from Northern Africa Ambulatory Disability

COMPARE

American
Race
Ancestry
AfghanAfricanAlaska NativeAlaskan AthabascanAlbanianAleutAlsatianAmericanApacheArabArapahoArgentineanArmenianAssyrian/Chaldean/SyriacAustralianAustrianBahamianBangladeshiBarbadianBasqueBelgianBelizeanBermudanBhutaneseBlackfeetBolivianBrazilianBritishBritish West IndianBulgarianBurmeseCajunCambodianCanadianCape VerdeanCarpatho RusynCelticCentral AmericanCentral American IndianCherokeeCheyenneChickasawChileanChineseChippewaChoctawColombianColvilleComancheCosta RicanCreeCreekCroatianCrowCubanCypriotCzechCzechoslovakianDanishDelawareDominicanDutchDutch West IndianEastern EuropeanEcuadorianEgyptianEnglishEstonianEthiopianEuropeanFijianFilipinoFinnishFrenchFrench American IndianFrench CanadianGermanGerman RussianGhanaianGreekGuamanian/ChamorroGuatemalanGuyaneseHaitianHmongHonduranHopiHoumaHungarianIcelanderIndian (Asian)IndonesianInupiatIranianIraqiIrishIroquoisIsraeliItalianJamaicanJapaneseJordanianKenyanKiowaKoreanLaotianLatvianLebaneseLiberianLithuanianLumbeeLuxembourgerMacedonianMalaysianMalteseMarshalleseMenomineeMexicanMexican American IndianMongolianMoroccanNative HawaiianNavajoNepaleseNew ZealanderNicaraguanNigerianNorthern EuropeanNorwegianOkinawanOsageOttawaPaiutePakistaniPalestinianPanamanianParaguayanPennsylvania GermanPeruvianPimaPolishPortuguesePotawatomiPuebloPuerto RicanPuget Sound SalishRomanianRussianSalvadoranSamoanScandinavianScotch-IrishScottishSeminoleSenegaleseSerbianShoshoneSierra LeoneanSiouxSlavicSlovakSloveneSomaliSouth AfricanSouth AmericanSouth American IndianSoviet UnionSpaniardSpanishSpanish AmericanSpanish American IndianSri LankanSubsaharan AfricanSudaneseSwedishSwissSyrianTaiwaneseThaiTlingit-HaidaTohono O'OdhamTonganTrinidadian and TobagonianTsimshianTurkishU.S. Virgin IslanderUgandanUkrainianUruguayanUteVenezuelanVietnameseWelshWest IndianYakamaYaquiYugoslavianYumanYup'ikZimbabwean
Immigration
NonimmigrantsImmigrantsAfghanistanAfricaAlbaniaArgentinaArmeniaAsiaAustraliaAustriaBahamasBangladeshBarbadosBelarusBelgiumBelizeBoliviaBosnia and HerzegovinaBrazilBulgariaBurma/MyanmarCabo VerdeCambodiaCameroonCanadaCaribbeanCentral AmericaChileChinaColombiaCongoCosta RicaCroatiaCubaCzechoslovakiaDenmarkDominicaDominican RepublicEastern AfricaEastern AsiaEastern EuropeEcuadorEgyptEl SalvadorEnglandEritreaEthiopiaEuropeFijiFranceGermanyGhanaGreeceGrenadaGuatemalaGuyanaHaitiHondurasHong KongHungaryIndiaIndonesiaIranIraqIrelandIsraelItalyJamaicaJapanJordanKazakhstanKenyaKoreaKuwaitLaosLatin AmericaLatviaLebanonLiberiaLithuaniaMalaysiaMexicoMicronesiaMiddle AfricaMoldovaMoroccoNepalNetherlandsNicaraguaNigeriaNorth AmericaNorth MacedoniaNorthern EuropeNorwayOceaniaPakistanPanamaPeruPhilippinesPolandPortugalRomaniaRussiaSaudi ArabiaScotlandSenegalSerbiaSierra LeoneSingaporeSomaliaSouth AfricaSouth AmericaSouth Central AsiaSouth Eastern AsiaSouthern EuropeSpainSri LankaSt. Vincent and the GrenadinesSudanSwedenSwitzerlandSyriaTaiwanThailandTrinidad and TobagoTurkeyUgandaUkraineUruguayUzbekistanVenezuelaVietnamWest IndiesWestern AfricaWestern AsiaWestern EuropeYemenZaireZimbabweAzores
Immigrants from Northern Africa
Race
Ancestry
AfghanAfricanAlaska NativeAlaskan AthabascanAlbanianAleutAlsatianApacheArabArapahoArgentineanArmenianAssyrian/Chaldean/SyriacAustralianAustrianBahamianBangladeshiBarbadianBasqueBelgianBelizeanBermudanBhutaneseBlackfeetBolivianBrazilianBritishBritish West IndianBulgarianBurmeseCajunCambodianCanadianCape VerdeanCarpatho RusynCelticCentral AmericanCentral American IndianCherokeeCheyenneChickasawChileanChineseChippewaChoctawColombianColvilleComancheCosta RicanCreeCreekCroatianCrowCubanCypriotCzechCzechoslovakianDanishDelawareDominicanDutchDutch West IndianEastern EuropeanEcuadorianEgyptianEnglishEstonianEthiopianEuropeanFijianFilipinoFinnishFrenchFrench American IndianFrench CanadianGermanGerman RussianGhanaianGreekGuamanian/ChamorroGuatemalanGuyaneseHaitianHmongHonduranHopiHoumaHungarianIcelanderIndian (Asian)IndonesianInupiatIranianIraqiIrishIroquoisIsraeliItalianJamaicanJapaneseJordanianKenyanKiowaKoreanLaotianLatvianLebaneseLiberianLithuanianLumbeeLuxembourgerMacedonianMalaysianMalteseMarshalleseMenomineeMexicanMexican American IndianMongolianMoroccanNative HawaiianNavajoNepaleseNew ZealanderNicaraguanNigerianNorthern EuropeanNorwegianOkinawanOsageOttawaPaiutePakistaniPalestinianPanamanianParaguayanPennsylvania GermanPeruvianPimaPolishPortuguesePotawatomiPuebloPuerto RicanPuget Sound SalishRomanianRussianSalvadoranSamoanScandinavianScotch-IrishScottishSeminoleSenegaleseSerbianShoshoneSierra LeoneanSiouxSlavicSlovakSloveneSomaliSouth AfricanSouth AmericanSouth American IndianSoviet UnionSpaniardSpanishSpanish AmericanSpanish American IndianSri LankanSubsaharan AfricanSudaneseSwedishSwissSyrianTaiwaneseThaiTlingit-HaidaTohono O'OdhamTonganTrinidadian and TobagonianTsimshianTurkishU.S. Virgin IslanderUgandanUkrainianUruguayanUteVenezuelanVietnameseWelshWest IndianYakamaYaquiYugoslavianYumanYup'ikZimbabwean
Immigration
NonimmigrantsImmigrantsAfghanistanAfricaAlbaniaArgentinaArmeniaAsiaAustraliaAustriaBahamasBangladeshBarbadosBelarusBelgiumBelizeBoliviaBosnia and HerzegovinaBrazilBulgariaBurma/MyanmarCabo VerdeCambodiaCameroonCanadaCaribbeanCentral AmericaChileChinaColombiaCongoCosta RicaCroatiaCubaCzechoslovakiaDenmarkDominicaDominican RepublicEastern AfricaEastern AsiaEastern EuropeEcuadorEgyptEl SalvadorEnglandEritreaEthiopiaEuropeFijiFranceGermanyGhanaGreeceGrenadaGuatemalaGuyanaHaitiHondurasHong KongHungaryIndiaIndonesiaIranIraqIrelandIsraelItalyJamaicaJapanJordanKazakhstanKenyaKoreaKuwaitLaosLatin AmericaLatviaLebanonLiberiaLithuaniaMalaysiaMexicoMicronesiaMiddle AfricaMoldovaMoroccoNepalNetherlandsNicaraguaNigeriaNorth AmericaNorth MacedoniaNorthern AfricaNorthern EuropeNorwayOceaniaPakistanPanamaPeruPhilippinesPolandPortugalRomaniaRussiaSaudi ArabiaScotlandSenegalSerbiaSierra LeoneSingaporeSomaliaSouth AfricaSouth AmericaSouth Central AsiaSouth Eastern AsiaSouthern EuropeSpainSri LankaSt. Vincent and the GrenadinesSudanSwedenSwitzerlandSyriaTaiwanThailandTrinidad and TobagoTurkeyUgandaUkraineUruguayUzbekistanVenezuelaVietnamWest IndiesWestern AfricaWestern AsiaWestern EuropeYemenZaireZimbabweAzores
Ambulatory Disability
Income
Poverty
Unemployment
Labor Participation
Family Structure
Vehicle Availability
Education Level
Disability

Ambulatory Disability Comparison

Americans

Immigrants from Northern Africa

Tragic
Exceptional
7.4%
AMBULATORY DISABILITY
0.0/ 100
METRIC RATING
323rd/ 347
METRIC RANK
5.7%
AMBULATORY DISABILITY
99.4/ 100
METRIC RATING
73rd/ 347
METRIC RANK

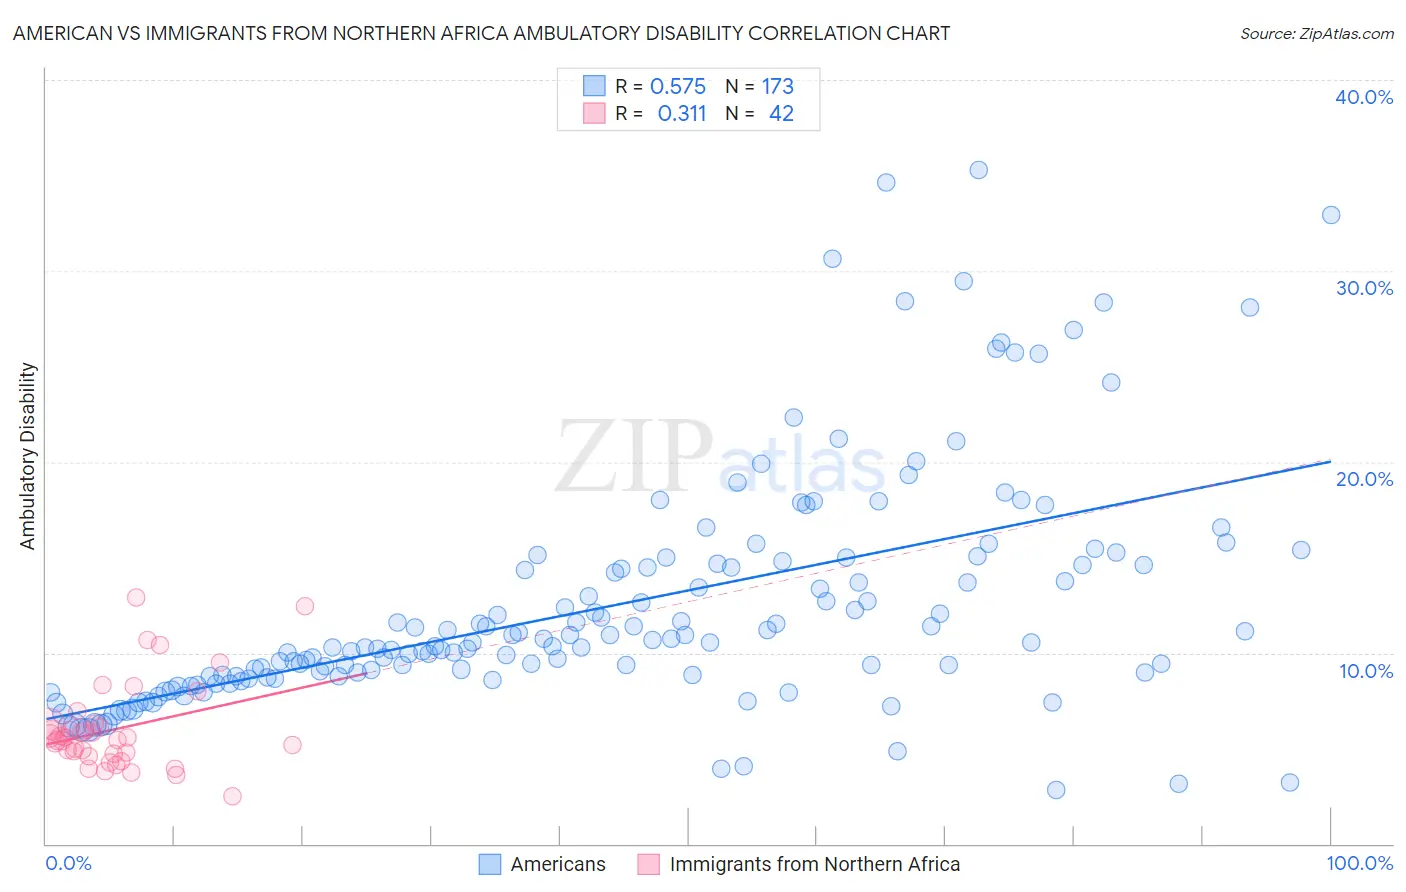
American vs Immigrants from Northern Africa Ambulatory Disability Correlation Chart

The statistical analysis conducted on geographies consisting of 581,324,022 people shows a substantial positive correlation between the proportion of Americans and percentage of population with ambulatory disability in the United States with a correlation coefficient (R) of 0.575 and weighted average of 7.4%. Similarly, the statistical analysis conducted on geographies consisting of 321,147,957 people shows a mild positive correlation between the proportion of Immigrants from Northern Africa and percentage of population with ambulatory disability in the United States with a correlation coefficient (R) of 0.311 and weighted average of 5.7%, a difference of 29.8%.
American vs Immigrants from Northern Africa Ambulatory Disability

Ambulatory Disability Correlation Summary

MeasurementAmericanImmigrants from Northern Africa
Minimum2.8%2.5%
Maximum35.3%12.9%
Range32.5%10.4%
Mean12.5%6.0%
Median10.5%5.5%
Interquartile 25% (IQ1)8.8%4.7%
Interquartile 75% (IQ3)14.6%6.1%
Interquartile Range (IQR)5.9%1.4%
Standard Deviation (Sample)6.2%2.3%
Standard Deviation (Population)6.1%2.3%

Similar Demographics by Ambulatory Disability

Demographics Similar to Americans by Ambulatory Disability

In terms of ambulatory disability, the demographic groups most similar to Americans are Osage (7.4%, a difference of 0.28%), Apache (7.4%, a difference of 0.42%), Potawatomi (7.3%, a difference of 1.2%), Navajo (7.5%, a difference of 1.3%), and Comanche (7.5%, a difference of 1.4%).
DemographicsRating | RankAmbulatory Disability
Immigrants | Dominican Republic
0.0
/100
|
#316
Tragic
7.1%
Central American Indians
0.0
/100
|
#317
Tragic
7.2%
Ottawa
0.0
/100
|
#318
Tragic
7.2%
Dominicans
0.0
/100
|
#319
Tragic
7.2%
Potawatomi
0.0
/100
|
#320
Tragic
7.3%
Apache
0.0
/100
|
#321
Tragic
7.4%
Osage
0.0
/100
|
#322
Tragic
7.4%
Americans
0.0
/100
|
#323
Tragic
7.4%
Navajo
0.0
/100
|
#324
Tragic
7.5%
Comanche
0.0
/100
|
#325
Tragic
7.5%
Blacks/African Americans
0.0
/100
|
#326
Tragic
7.5%
Natives/Alaskans
0.0
/100
|
#327
Tragic
7.5%
Hopi
0.0
/100
|
#328
Tragic
7.6%
Pueblo
0.0
/100
|
#329
Tragic
7.6%
Paiute
0.0
/100
|
#330
Tragic
7.7%

Demographics Similar to Immigrants from Northern Africa by Ambulatory Disability

In terms of ambulatory disability, the demographic groups most similar to Immigrants from Northern Africa are Immigrants from Cameroon (5.7%, a difference of 0.010%), Brazilian (5.7%, a difference of 0.020%), Immigrants from Peru (5.7%, a difference of 0.040%), Immigrants from South Africa (5.7%, a difference of 0.060%), and Sudanese (5.7%, a difference of 0.080%).
DemographicsRating | RankAmbulatory Disability
Israelis
99.6
/100
|
#66
Exceptional
5.7%
Immigrants | Uganda
99.6
/100
|
#67
Exceptional
5.7%
Sri Lankans
99.6
/100
|
#68
Exceptional
5.7%
Peruvians
99.5
/100
|
#69
Exceptional
5.7%
Sierra Leoneans
99.4
/100
|
#70
Exceptional
5.7%
Immigrants | Peru
99.4
/100
|
#71
Exceptional
5.7%
Brazilians
99.4
/100
|
#72
Exceptional
5.7%
Immigrants | Northern Africa
99.4
/100
|
#73
Exceptional
5.7%
Immigrants | Cameroon
99.4
/100
|
#74
Exceptional
5.7%
Immigrants | South Africa
99.3
/100
|
#75
Exceptional
5.7%
Sudanese
99.3
/100
|
#76
Exceptional
5.7%
Immigrants | Vietnam
99.3
/100
|
#77
Exceptional
5.7%
Somalis
99.2
/100
|
#78
Exceptional
5.7%
Chileans
99.2
/100
|
#79
Exceptional
5.7%
Immigrants | Ireland
99.2
/100
|
#80
Exceptional
5.7%