Spanish American vs Immigrants from Northern Africa Ambulatory Disability
COMPARE
Spanish American
Immigrants from Northern Africa
Ambulatory Disability
Ambulatory Disability Comparison
Spanish Americans
Immigrants from Northern Africa
7.1%
AMBULATORY DISABILITY
0.0/ 100
METRIC RATING
307th/ 347
METRIC RANK
5.7%
AMBULATORY DISABILITY
99.4/ 100
METRIC RATING
73rd/ 347
METRIC RANK
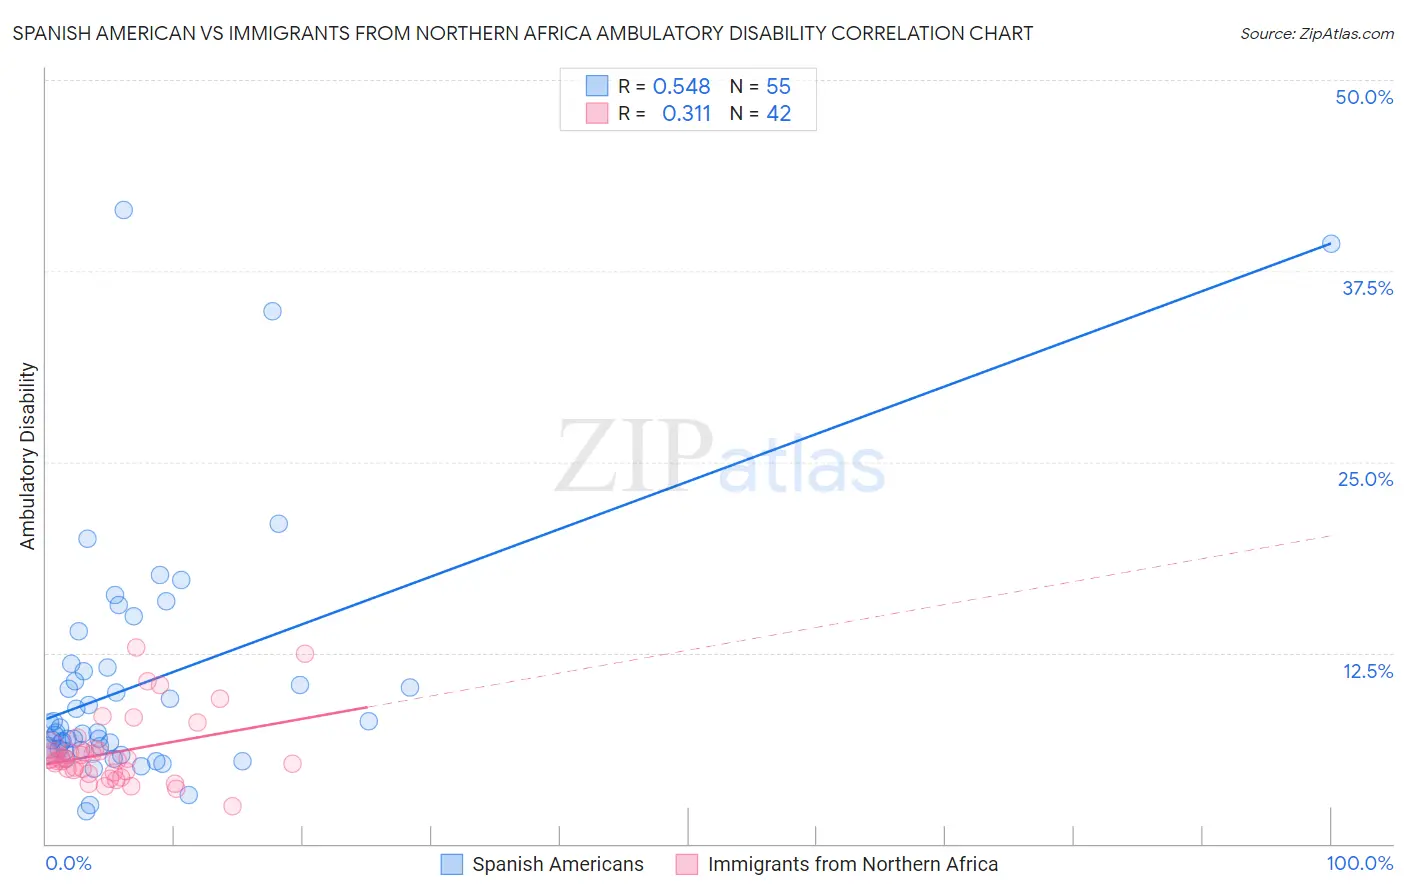
Spanish American vs Immigrants from Northern Africa Ambulatory Disability Correlation Chart
The statistical analysis conducted on geographies consisting of 103,166,807 people shows a substantial positive correlation between the proportion of Spanish Americans and percentage of population with ambulatory disability in the United States with a correlation coefficient (R) of 0.548 and weighted average of 7.1%. Similarly, the statistical analysis conducted on geographies consisting of 321,147,957 people shows a mild positive correlation between the proportion of Immigrants from Northern Africa and percentage of population with ambulatory disability in the United States with a correlation coefficient (R) of 0.311 and weighted average of 5.7%, a difference of 23.9%.
Ambulatory Disability Correlation Summary
| Measurement | Spanish American | Immigrants from Northern Africa |
| Minimum | 2.1% | 2.5% |
| Maximum | 41.5% | 12.9% |
| Range | 39.4% | 10.4% |
| Mean | 10.5% | 6.0% |
| Median | 7.3% | 5.5% |
| Interquartile 25% (IQ1) | 6.1% | 4.7% |
| Interquartile 75% (IQ3) | 11.5% | 6.1% |
| Interquartile Range (IQR) | 5.4% | 1.4% |
| Standard Deviation (Sample) | 8.0% | 2.3% |
| Standard Deviation (Population) | 8.0% | 2.3% |
Similar Demographics by Ambulatory Disability
Demographics Similar to Spanish Americans by Ambulatory Disability
In terms of ambulatory disability, the demographic groups most similar to Spanish Americans are Chippewa (7.1%, a difference of 0.0%), Immigrants from the Azores (7.1%, a difference of 0.17%), Iroquois (7.1%, a difference of 0.26%), Arapaho (7.1%, a difference of 0.45%), and Cree (7.1%, a difference of 0.46%).
| Demographics | Rating | Rank | Ambulatory Disability |
| Marshallese | 0.0 /100 | #300 | Tragic 6.9% |
| British West Indians | 0.0 /100 | #301 | Tragic 7.0% |
| Immigrants | Armenia | 0.0 /100 | #302 | Tragic 7.0% |
| Africans | 0.0 /100 | #303 | Tragic 7.0% |
| Immigrants | Cabo Verde | 0.0 /100 | #304 | Tragic 7.0% |
| Immigrants | Micronesia | 0.0 /100 | #305 | Tragic 7.0% |
| Iroquois | 0.0 /100 | #306 | Tragic 7.1% |
| Spanish Americans | 0.0 /100 | #307 | Tragic 7.1% |
| Chippewa | 0.0 /100 | #308 | Tragic 7.1% |
| Immigrants | Azores | 0.0 /100 | #309 | Tragic 7.1% |
| Arapaho | 0.0 /100 | #310 | Tragic 7.1% |
| Cree | 0.0 /100 | #311 | Tragic 7.1% |
| Delaware | 0.0 /100 | #312 | Tragic 7.1% |
| Immigrants | Yemen | 0.0 /100 | #313 | Tragic 7.1% |
| Blackfeet | 0.0 /100 | #314 | Tragic 7.1% |
Demographics Similar to Immigrants from Northern Africa by Ambulatory Disability
In terms of ambulatory disability, the demographic groups most similar to Immigrants from Northern Africa are Immigrants from Cameroon (5.7%, a difference of 0.010%), Brazilian (5.7%, a difference of 0.020%), Immigrants from Peru (5.7%, a difference of 0.040%), Immigrants from South Africa (5.7%, a difference of 0.060%), and Sudanese (5.7%, a difference of 0.080%).
| Demographics | Rating | Rank | Ambulatory Disability |
| Israelis | 99.6 /100 | #66 | Exceptional 5.7% |
| Immigrants | Uganda | 99.6 /100 | #67 | Exceptional 5.7% |
| Sri Lankans | 99.6 /100 | #68 | Exceptional 5.7% |
| Peruvians | 99.5 /100 | #69 | Exceptional 5.7% |
| Sierra Leoneans | 99.4 /100 | #70 | Exceptional 5.7% |
| Immigrants | Peru | 99.4 /100 | #71 | Exceptional 5.7% |
| Brazilians | 99.4 /100 | #72 | Exceptional 5.7% |
| Immigrants | Northern Africa | 99.4 /100 | #73 | Exceptional 5.7% |
| Immigrants | Cameroon | 99.4 /100 | #74 | Exceptional 5.7% |
| Immigrants | South Africa | 99.3 /100 | #75 | Exceptional 5.7% |
| Sudanese | 99.3 /100 | #76 | Exceptional 5.7% |
| Immigrants | Vietnam | 99.3 /100 | #77 | Exceptional 5.7% |
| Somalis | 99.2 /100 | #78 | Exceptional 5.7% |
| Chileans | 99.2 /100 | #79 | Exceptional 5.7% |
| Immigrants | Ireland | 99.2 /100 | #80 | Exceptional 5.7% |