American vs Immigrants from Liberia Ambulatory Disability
COMPARE
American
Immigrants from Liberia
Ambulatory Disability
Ambulatory Disability Comparison
Americans
Immigrants from Liberia
7.4%
AMBULATORY DISABILITY
0.0/ 100
METRIC RATING
323rd/ 347
METRIC RANK
6.4%
AMBULATORY DISABILITY
2.3/ 100
METRIC RATING
234th/ 347
METRIC RANK
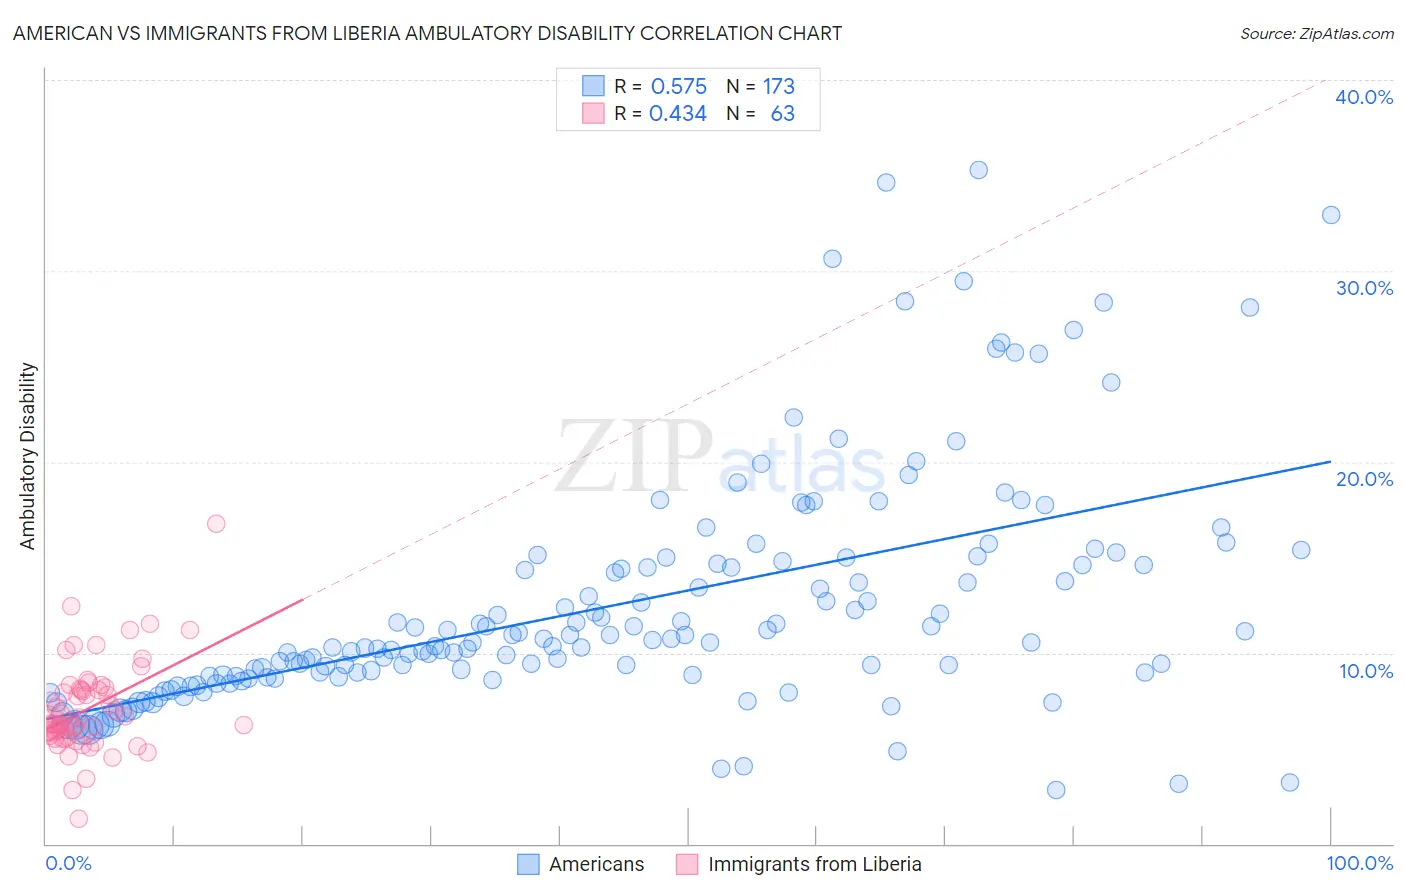
American vs Immigrants from Liberia Ambulatory Disability Correlation Chart
The statistical analysis conducted on geographies consisting of 581,324,022 people shows a substantial positive correlation between the proportion of Americans and percentage of population with ambulatory disability in the United States with a correlation coefficient (R) of 0.575 and weighted average of 7.4%. Similarly, the statistical analysis conducted on geographies consisting of 135,254,845 people shows a moderate positive correlation between the proportion of Immigrants from Liberia and percentage of population with ambulatory disability in the United States with a correlation coefficient (R) of 0.434 and weighted average of 6.4%, a difference of 15.4%.
Ambulatory Disability Correlation Summary
| Measurement | American | Immigrants from Liberia |
| Minimum | 2.8% | 1.3% |
| Maximum | 35.3% | 16.8% |
| Range | 32.5% | 15.5% |
| Mean | 12.5% | 7.1% |
| Median | 10.5% | 6.3% |
| Interquartile 25% (IQ1) | 8.8% | 5.6% |
| Interquartile 75% (IQ3) | 14.6% | 8.1% |
| Interquartile Range (IQR) | 5.9% | 2.5% |
| Standard Deviation (Sample) | 6.2% | 2.4% |
| Standard Deviation (Population) | 6.1% | 2.4% |
Similar Demographics by Ambulatory Disability
Demographics Similar to Americans by Ambulatory Disability
In terms of ambulatory disability, the demographic groups most similar to Americans are Osage (7.4%, a difference of 0.28%), Apache (7.4%, a difference of 0.42%), Potawatomi (7.3%, a difference of 1.2%), Navajo (7.5%, a difference of 1.3%), and Comanche (7.5%, a difference of 1.4%).
| Demographics | Rating | Rank | Ambulatory Disability |
| Immigrants | Dominican Republic | 0.0 /100 | #316 | Tragic 7.1% |
| Central American Indians | 0.0 /100 | #317 | Tragic 7.2% |
| Ottawa | 0.0 /100 | #318 | Tragic 7.2% |
| Dominicans | 0.0 /100 | #319 | Tragic 7.2% |
| Potawatomi | 0.0 /100 | #320 | Tragic 7.3% |
| Apache | 0.0 /100 | #321 | Tragic 7.4% |
| Osage | 0.0 /100 | #322 | Tragic 7.4% |
| Americans | 0.0 /100 | #323 | Tragic 7.4% |
| Navajo | 0.0 /100 | #324 | Tragic 7.5% |
| Comanche | 0.0 /100 | #325 | Tragic 7.5% |
| Blacks/African Americans | 0.0 /100 | #326 | Tragic 7.5% |
| Natives/Alaskans | 0.0 /100 | #327 | Tragic 7.5% |
| Hopi | 0.0 /100 | #328 | Tragic 7.6% |
| Pueblo | 0.0 /100 | #329 | Tragic 7.6% |
| Paiute | 0.0 /100 | #330 | Tragic 7.7% |
Demographics Similar to Immigrants from Liberia by Ambulatory Disability
In terms of ambulatory disability, the demographic groups most similar to Immigrants from Liberia are Subsaharan African (6.4%, a difference of 0.030%), Hispanic or Latino (6.4%, a difference of 0.030%), Assyrian/Chaldean/Syriac (6.4%, a difference of 0.090%), Dutch (6.4%, a difference of 0.18%), and Immigrants from Germany (6.4%, a difference of 0.27%).
| Demographics | Rating | Rank | Ambulatory Disability |
| Cubans | 4.0 /100 | #227 | Tragic 6.4% |
| Portuguese | 4.0 /100 | #228 | Tragic 6.4% |
| Czechoslovakians | 3.8 /100 | #229 | Tragic 6.4% |
| Mexicans | 3.5 /100 | #230 | Tragic 6.4% |
| Panamanians | 3.1 /100 | #231 | Tragic 6.4% |
| Assyrians/Chaldeans/Syriacs | 2.4 /100 | #232 | Tragic 6.4% |
| Sub-Saharan Africans | 2.3 /100 | #233 | Tragic 6.4% |
| Immigrants | Liberia | 2.3 /100 | #234 | Tragic 6.4% |
| Hispanics or Latinos | 2.2 /100 | #235 | Tragic 6.4% |
| Dutch | 2.0 /100 | #236 | Tragic 6.4% |
| Immigrants | Germany | 1.8 /100 | #237 | Tragic 6.4% |
| Haitians | 1.8 /100 | #238 | Tragic 6.4% |
| Senegalese | 1.7 /100 | #239 | Tragic 6.4% |
| Immigrants | Senegal | 1.7 /100 | #240 | Tragic 6.4% |
| Immigrants | Haiti | 1.6 /100 | #241 | Tragic 6.5% |