Alsatian vs Irish Disability Age 65 to 74
COMPARE
Alsatian
Irish
Disability Age 65 to 74
Disability Age 65 to 74 Comparison
Alsatians
Irish
22.8%
DISABILITY AGE 65 TO 74
83.7/ 100
METRIC RATING
146th/ 347
METRIC RANK
23.4%
DISABILITY AGE 65 TO 74
44.4/ 100
METRIC RATING
182nd/ 347
METRIC RANK
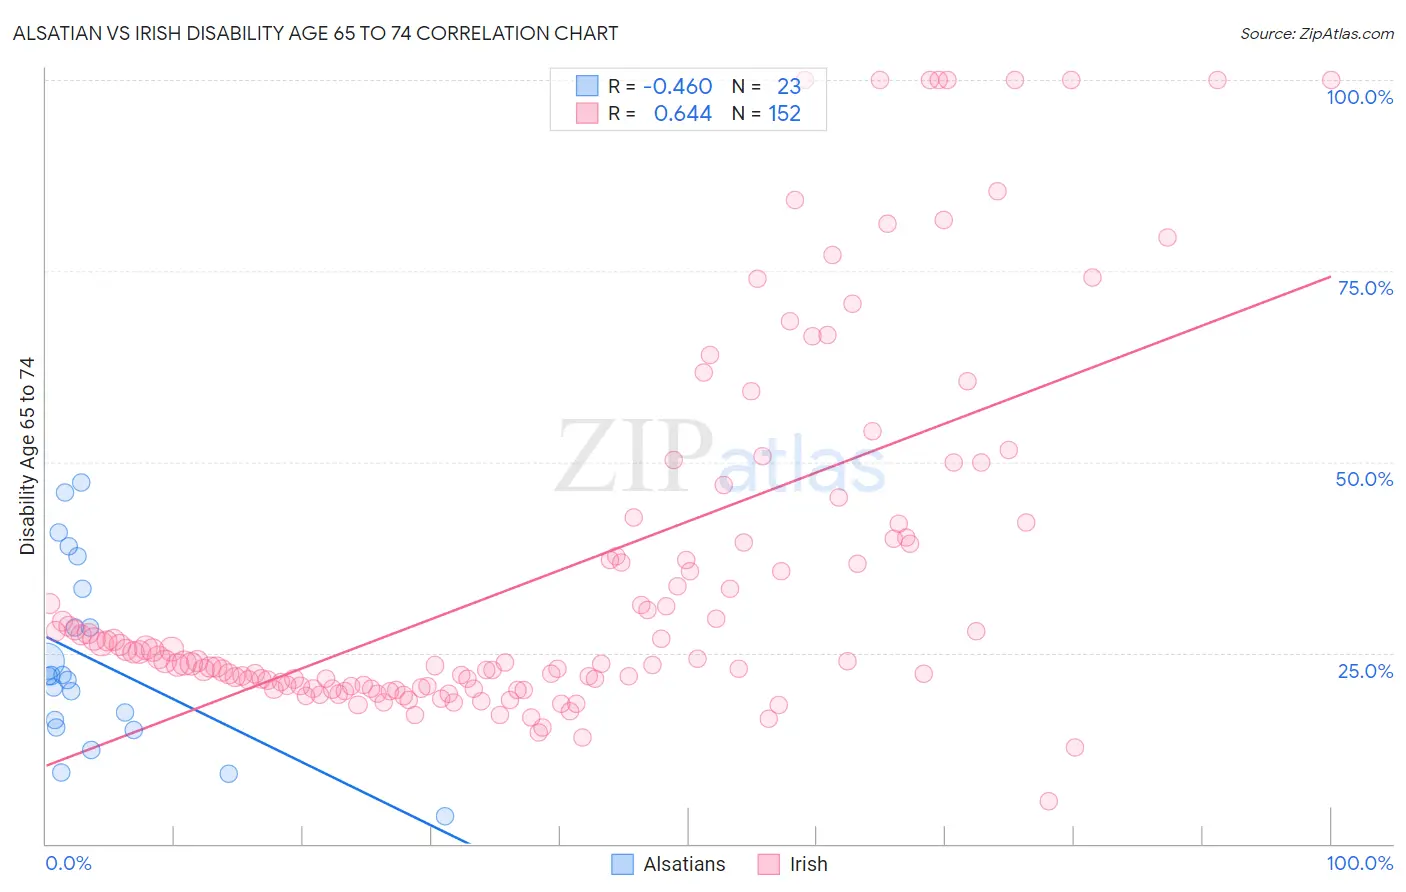
Alsatian vs Irish Disability Age 65 to 74 Correlation Chart
The statistical analysis conducted on geographies consisting of 82,675,825 people shows a moderate negative correlation between the proportion of Alsatians and percentage of population with a disability between the ages 65 and 75 in the United States with a correlation coefficient (R) of -0.460 and weighted average of 22.8%. Similarly, the statistical analysis conducted on geographies consisting of 577,447,046 people shows a significant positive correlation between the proportion of Irish and percentage of population with a disability between the ages 65 and 75 in the United States with a correlation coefficient (R) of 0.644 and weighted average of 23.4%, a difference of 2.8%.
Disability Age 65 to 74 Correlation Summary
| Measurement | Alsatian | Irish |
| Minimum | 3.7% | 5.6% |
| Maximum | 47.3% | 100.0% |
| Range | 43.7% | 94.4% |
| Mean | 23.9% | 35.1% |
| Median | 22.0% | 23.9% |
| Interquartile 25% (IQ1) | 15.2% | 20.6% |
| Interquartile 75% (IQ3) | 33.3% | 39.7% |
| Interquartile Range (IQR) | 18.2% | 19.1% |
| Standard Deviation (Sample) | 12.0% | 23.3% |
| Standard Deviation (Population) | 11.7% | 23.3% |
Similar Demographics by Disability Age 65 to 74
Demographics Similar to Alsatians by Disability Age 65 to 74
In terms of disability age 65 to 74, the demographic groups most similar to Alsatians are Immigrants from Uganda (22.8%, a difference of 0.030%), Danish (22.8%, a difference of 0.070%), Immigrants from Uzbekistan (22.8%, a difference of 0.070%), Arab (22.8%, a difference of 0.12%), and Immigrants from Ethiopia (22.7%, a difference of 0.18%).
| Demographics | Rating | Rank | Disability Age 65 to 74 |
| Immigrants | Syria | 85.8 /100 | #139 | Excellent 22.7% |
| Ugandans | 85.4 /100 | #140 | Excellent 22.7% |
| Belgians | 85.3 /100 | #141 | Excellent 22.7% |
| Immigrants | Ethiopia | 85.3 /100 | #142 | Excellent 22.7% |
| Arabs | 84.8 /100 | #143 | Excellent 22.8% |
| Danes | 84.4 /100 | #144 | Excellent 22.8% |
| Immigrants | Uganda | 84.0 /100 | #145 | Excellent 22.8% |
| Alsatians | 83.7 /100 | #146 | Excellent 22.8% |
| Immigrants | Uzbekistan | 83.1 /100 | #147 | Excellent 22.8% |
| New Zealanders | 79.9 /100 | #148 | Good 22.9% |
| Swiss | 79.7 /100 | #149 | Good 22.9% |
| Canadians | 77.7 /100 | #150 | Good 22.9% |
| Immigrants | Morocco | 77.6 /100 | #151 | Good 22.9% |
| Finns | 76.5 /100 | #152 | Good 22.9% |
| Slavs | 75.2 /100 | #153 | Good 23.0% |
Demographics Similar to Irish by Disability Age 65 to 74
In terms of disability age 65 to 74, the demographic groups most similar to Irish are Assyrian/Chaldean/Syriac (23.4%, a difference of 0.060%), Scandinavian (23.4%, a difference of 0.070%), Immigrants from Sierra Leone (23.4%, a difference of 0.080%), Guyanese (23.4%, a difference of 0.090%), and Immigrants from Eastern Africa (23.4%, a difference of 0.090%).
| Demographics | Rating | Rank | Disability Age 65 to 74 |
| Dutch | 49.4 /100 | #175 | Average 23.3% |
| Immigrants | Eritrea | 47.5 /100 | #176 | Average 23.4% |
| Immigrants | Haiti | 47.5 /100 | #177 | Average 23.4% |
| Guyanese | 45.8 /100 | #178 | Average 23.4% |
| Immigrants | Sierra Leone | 45.8 /100 | #179 | Average 23.4% |
| Scandinavians | 45.6 /100 | #180 | Average 23.4% |
| Assyrians/Chaldeans/Syriacs | 45.3 /100 | #181 | Average 23.4% |
| Irish | 44.4 /100 | #182 | Average 23.4% |
| Immigrants | Eastern Africa | 42.8 /100 | #183 | Average 23.4% |
| Immigrants | Germany | 42.5 /100 | #184 | Average 23.4% |
| Haitians | 42.4 /100 | #185 | Average 23.4% |
| Basques | 38.4 /100 | #186 | Fair 23.5% |
| Portuguese | 37.8 /100 | #187 | Fair 23.5% |
| Immigrants | Cuba | 34.0 /100 | #188 | Fair 23.6% |
| Scottish | 33.1 /100 | #189 | Fair 23.6% |