Zip Codes with the Highest Percentage of Population Employed in Transportation & Warehousing in Whittier, CA
RELATED REPORTS & OPTIONS
Transportation & Warehousing
Whittier
Compare Zip Codes
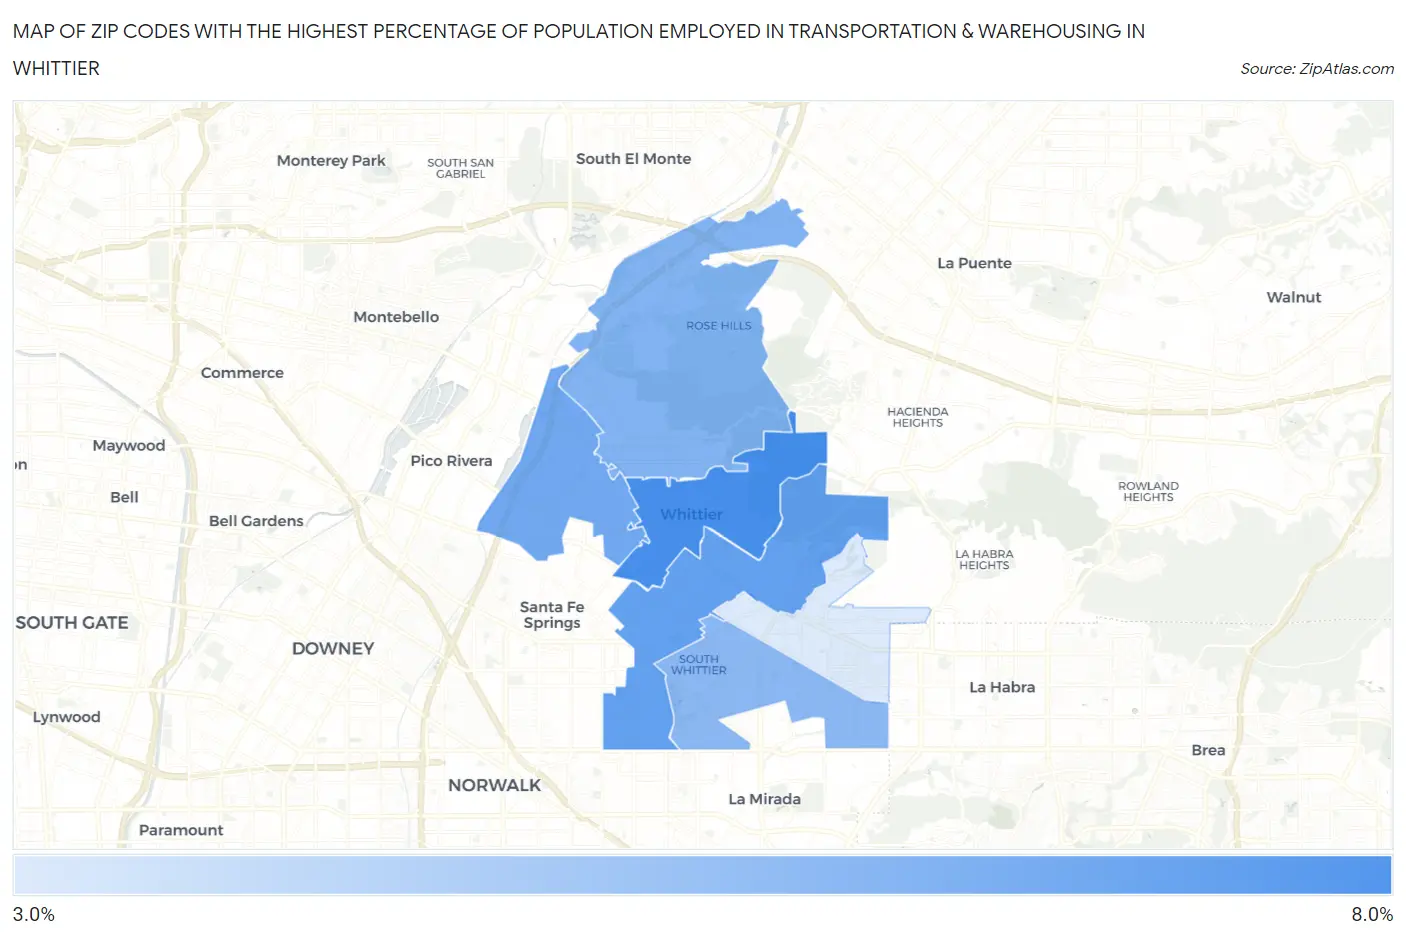
Map of Zip Codes with the Highest Percentage of Population Employed in Transportation & Warehousing in Whittier
3.9%
7.8%
Zip Codes with the Highest Percentage of Population Employed in Transportation & Warehousing in Whittier, CA
| Zip Code | % Employed | vs State | vs National | |
| 1. | 90602 | 7.8% | 5.1%(+2.64)#229 | 4.9%(+2.83)#5,223 |
| 2. | 90605 | 7.1% | 5.1%(+1.94)#298 | 4.9%(+2.12)#6,414 |
| 3. | 90606 | 6.7% | 5.1%(+1.54)#353 | 4.9%(+1.72)#7,220 |
| 4. | 90601 | 6.3% | 5.1%(+1.16)#394 | 4.9%(+1.34)#8,071 |
| 5. | 90604 | 6.0% | 5.1%(+0.898)#420 | 4.9%(+1.08)#8,721 |
| 6. | 90603 | 3.9% | 5.1%(-1.19)#774 | 4.9%(-1.01)#16,192 |
1
Common Questions
What are the Top 5 Zip Codes with the Highest Percentage of Population Employed in Transportation & Warehousing in Whittier, CA?
Top 5 Zip Codes with the Highest Percentage of Population Employed in Transportation & Warehousing in Whittier, CA are:
What zip code has the Highest Percentage of Population Employed in Transportation & Warehousing in Whittier, CA?
90602 has the Highest Percentage of Population Employed in Transportation & Warehousing in Whittier, CA with 7.8%.
What is the Percentage of Population Employed in Transportation & Warehousing in Whittier, CA?
Percentage of Population Employed in Transportation & Warehousing in Whittier is 6.3%.
What is the Percentage of Population Employed in Transportation & Warehousing in California?
Percentage of Population Employed in Transportation & Warehousing in California is 5.1%.
What is the Percentage of Population Employed in Transportation & Warehousing in the United States?
Percentage of Population Employed in Transportation & Warehousing in the United States is 4.9%.