Zip Codes with the Highest Percentage of Population Employed in Arts, Entertainment & Recreation in Whittier, CA
RELATED REPORTS & OPTIONS
Arts, Entertainment & Recreation
Whittier
Compare Zip Codes
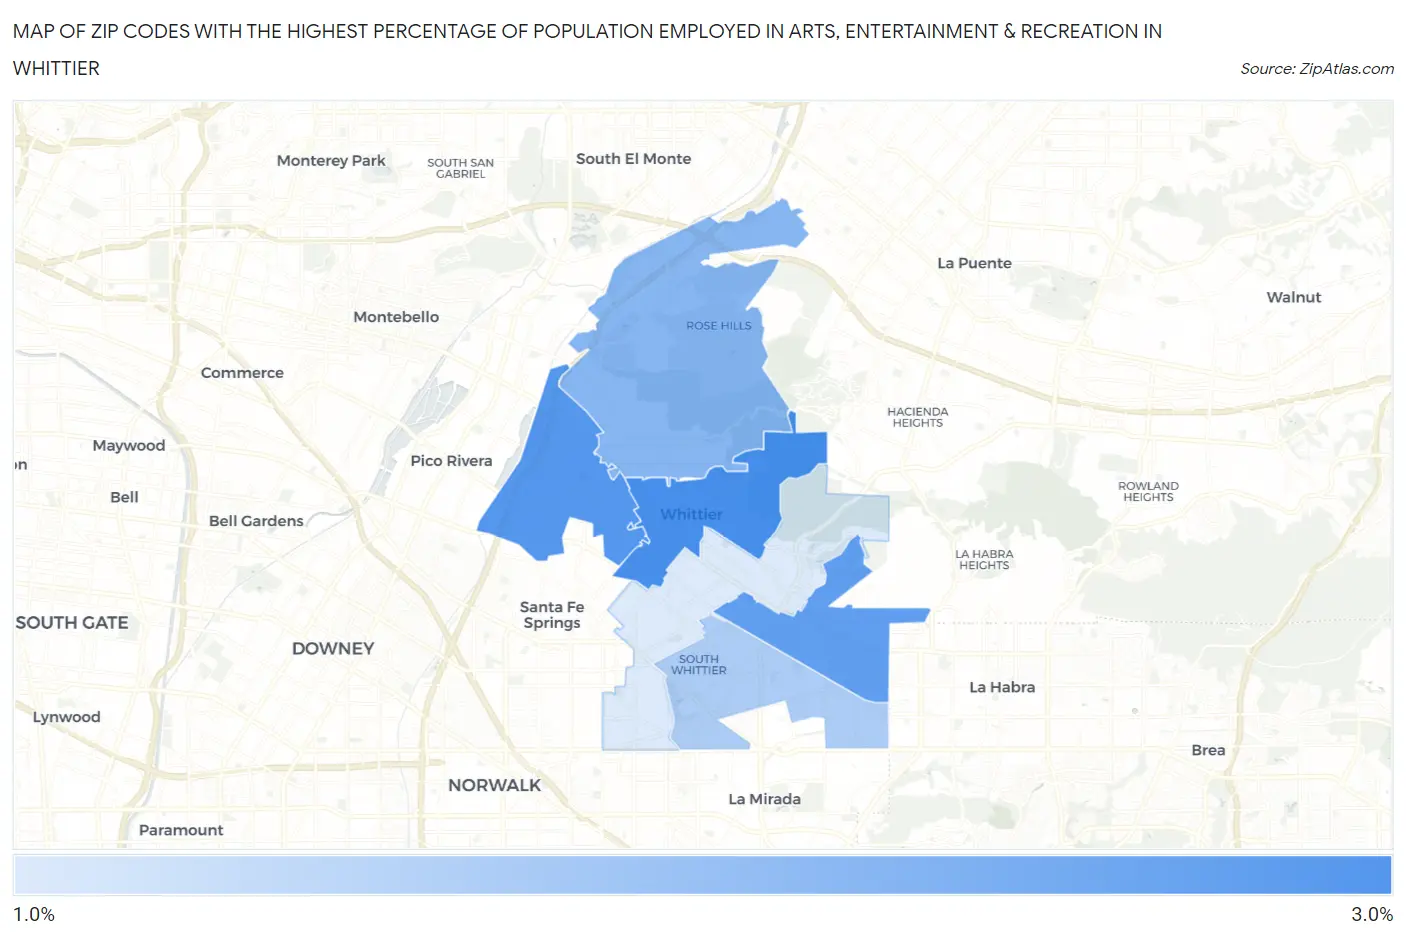
Map of Zip Codes with the Highest Percentage of Population Employed in Arts, Entertainment & Recreation in Whittier
0.0%
3.0%
Zip Codes with the Highest Percentage of Population Employed in Arts, Entertainment & Recreation in Whittier, CA
| Zip Code | % Employed | vs State | vs National | |
| 1. | 90602 | 2.6% | 2.6%(+0.090)#619 | 2.1%(+0.561)#6,591 |
| 2. | 90606 | 2.6% | 2.6%(+0.025)#643 | 2.1%(+0.497)#6,839 |
| 3. | 90603 | 2.5% | 2.6%(-0.038)#681 | 2.1%(+0.433)#7,116 |
| 4. | 90601 | 2.3% | 2.6%(-0.236)#764 | 2.1%(+0.235)#8,042 |
| 5. | 90604 | 2.1% | 2.6%(-0.427)#858 | 2.1%(+0.044)#9,064 |
| 6. | 90605 | 1.9% | 2.6%(-0.666)#965 | 2.1%(-0.195)#10,448 |
1
Common Questions
What are the Top 5 Zip Codes with the Highest Percentage of Population Employed in Arts, Entertainment & Recreation in Whittier, CA?
Top 5 Zip Codes with the Highest Percentage of Population Employed in Arts, Entertainment & Recreation in Whittier, CA are:
What zip code has the Highest Percentage of Population Employed in Arts, Entertainment & Recreation in Whittier, CA?
90602 has the Highest Percentage of Population Employed in Arts, Entertainment & Recreation in Whittier, CA with 2.6%.
What is the Percentage of Population Employed in Arts, Entertainment & Recreation in Whittier, CA?
Percentage of Population Employed in Arts, Entertainment & Recreation in Whittier is 2.5%.
What is the Percentage of Population Employed in Arts, Entertainment & Recreation in California?
Percentage of Population Employed in Arts, Entertainment & Recreation in California is 2.6%.
What is the Percentage of Population Employed in Arts, Entertainment & Recreation in the United States?
Percentage of Population Employed in Arts, Entertainment & Recreation in the United States is 2.1%.