Zip Codes with the Highest Percentage of Population Employed in Food Preparation & Serving in San Bernardino, CA
RELATED REPORTS & OPTIONS
Food Preparation & Serving
San Bernardino
Compare Zip Codes
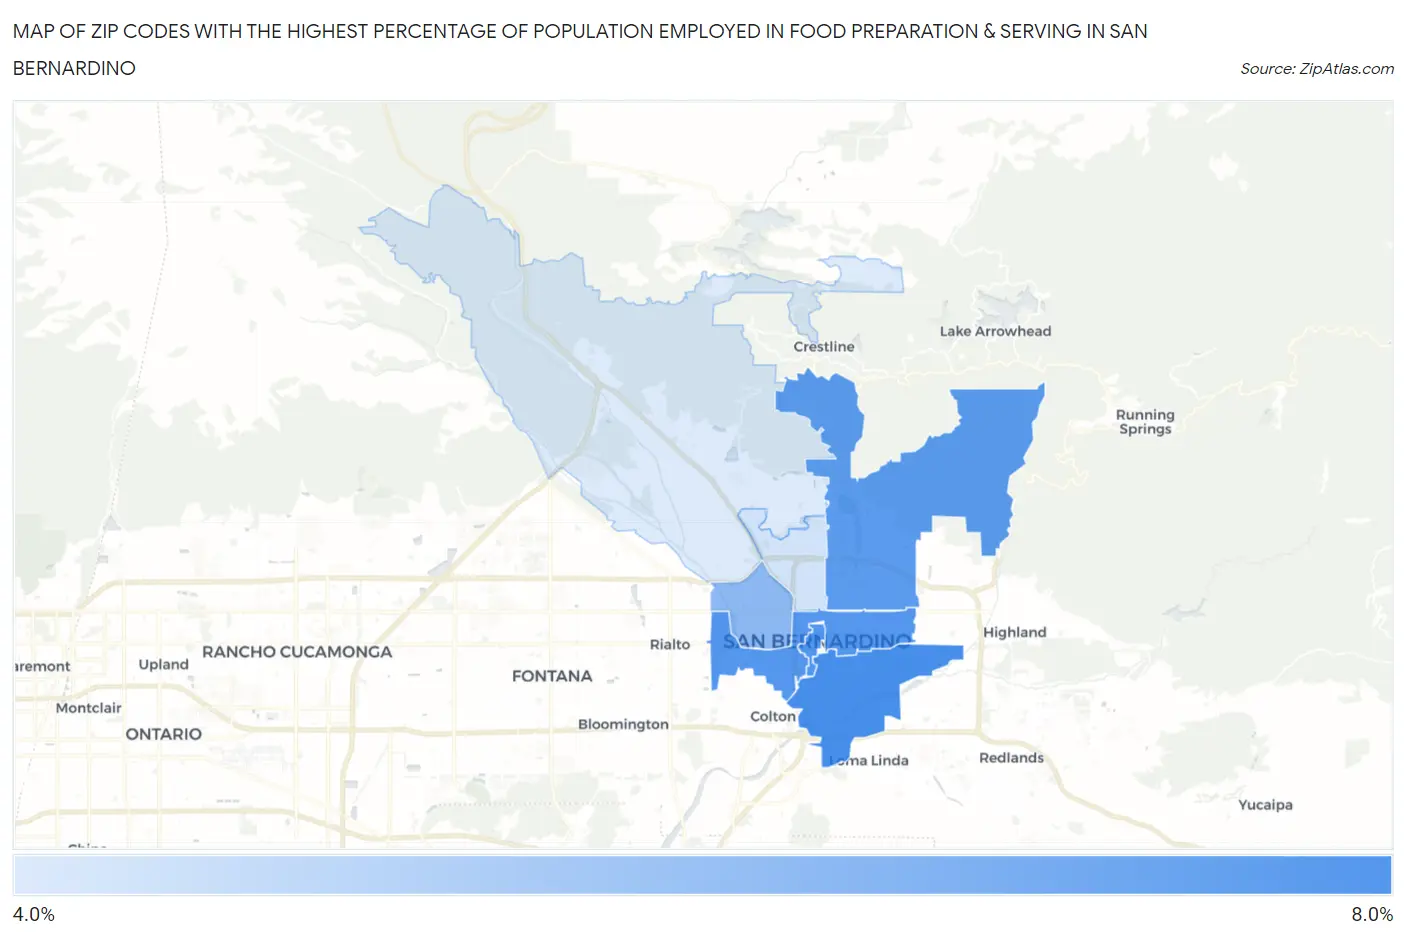
Map of Zip Codes with the Highest Percentage of Population Employed in Food Preparation & Serving in San Bernardino
5.0%
6.9%
Zip Codes with the Highest Percentage of Population Employed in Food Preparation & Serving in San Bernardino, CA
| Zip Code | % Employed | vs State | vs National | |
| 1. | 92408 | 6.9% | 5.4%(+1.51)#359 | 5.3%(+1.61)#6,841 |
| 2. | 92401 | 6.7% | 5.4%(+1.36)#393 | 5.3%(+1.46)#7,227 |
| 3. | 92410 | 6.7% | 5.4%(+1.33)#402 | 5.3%(+1.43)#7,308 |
| 4. | 92404 | 6.6% | 5.4%(+1.26)#419 | 5.3%(+1.35)#7,508 |
| 5. | 92411 | 6.0% | 5.4%(+0.608)#546 | 5.3%(+0.704)#9,375 |
| 6. | 92405 | 5.1% | 5.4%(-0.259)#749 | 5.3%(-0.163)#12,454 |
| 7. | 92407 | 5.0% | 5.4%(-0.411)#791 | 5.3%(-0.314)#13,052 |
1
Common Questions
What are the Top 5 Zip Codes with the Highest Percentage of Population Employed in Food Preparation & Serving in San Bernardino, CA?
Top 5 Zip Codes with the Highest Percentage of Population Employed in Food Preparation & Serving in San Bernardino, CA are:
What zip code has the Highest Percentage of Population Employed in Food Preparation & Serving in San Bernardino, CA?
92408 has the Highest Percentage of Population Employed in Food Preparation & Serving in San Bernardino, CA with 6.9%.
What is the Percentage of Population Employed in Food Preparation & Serving in San Bernardino, CA?
Percentage of Population Employed in Food Preparation & Serving in San Bernardino is 5.5%.
What is the Percentage of Population Employed in Food Preparation & Serving in California?
Percentage of Population Employed in Food Preparation & Serving in California is 5.4%.
What is the Percentage of Population Employed in Food Preparation & Serving in the United States?
Percentage of Population Employed in Food Preparation & Serving in the United States is 5.3%.