Zip Codes with the Highest Percentage of Population Employed in Food Preparation & Serving in Stockton, CA
RELATED REPORTS & OPTIONS
Food Preparation & Serving
Stockton
Compare Zip Codes
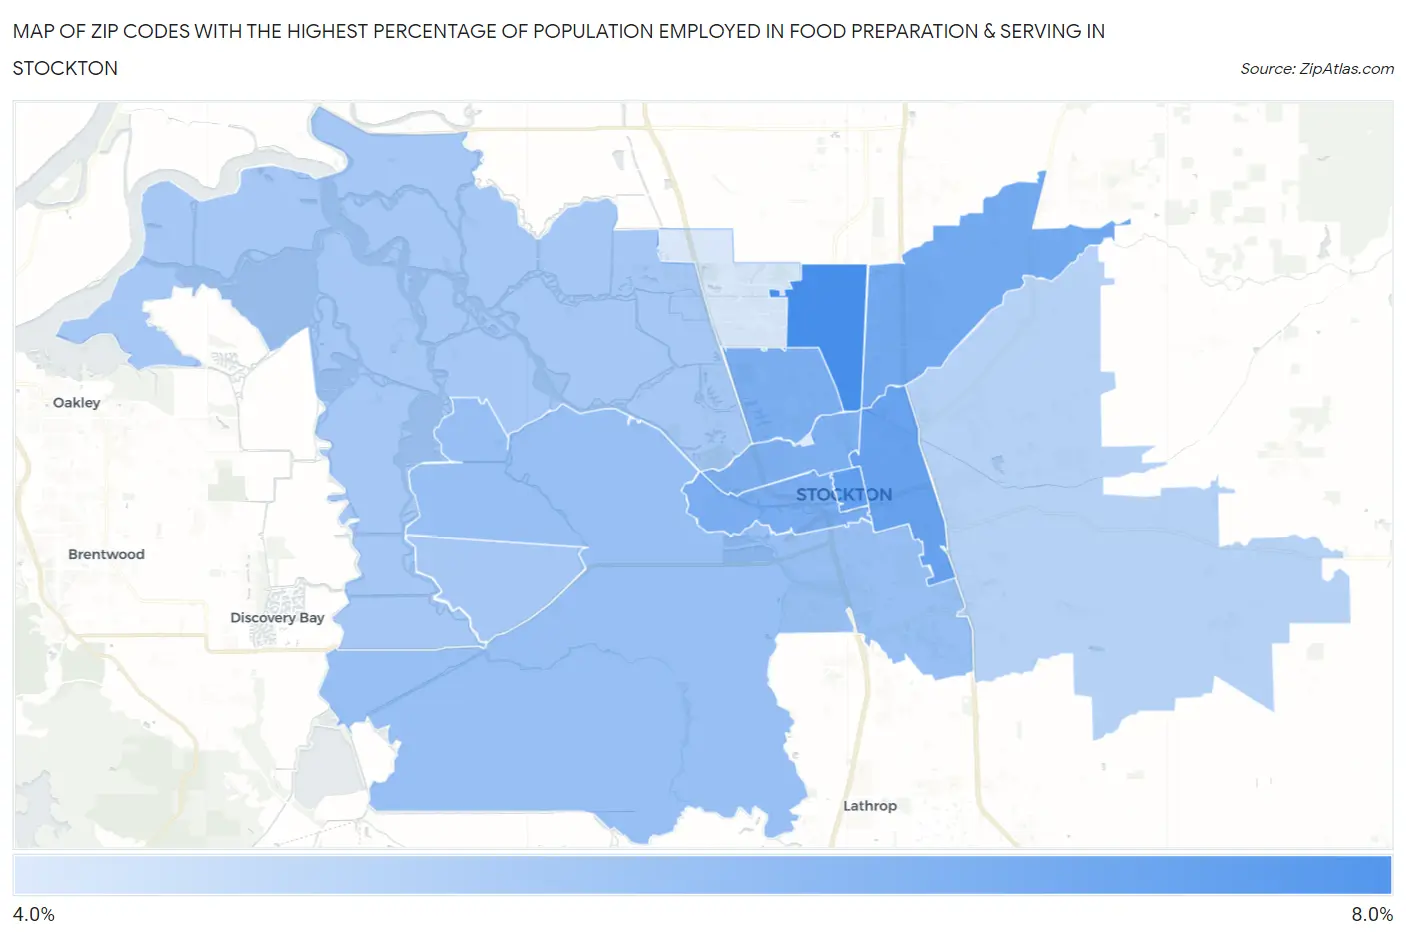
Map of Zip Codes with the Highest Percentage of Population Employed in Food Preparation & Serving in Stockton
4.1%
7.4%
Zip Codes with the Highest Percentage of Population Employed in Food Preparation & Serving in Stockton, CA
| Zip Code | % Employed | vs State | vs National | |
| 1. | 95210 | 7.4% | 5.4%(+1.99)#291 | 5.3%(+2.09)#5,795 |
| 2. | 95202 | 6.8% | 5.4%(+1.37)#388 | 5.3%(+1.47)#7,193 |
| 3. | 95205 | 6.7% | 5.4%(+1.28)#411 | 5.3%(+1.38)#7,446 |
| 4. | 95212 | 6.4% | 5.4%(+1.06)#455 | 5.3%(+1.15)#8,037 |
| 5. | 95203 | 6.3% | 5.4%(+0.869)#497 | 5.3%(+0.966)#8,571 |
| 6. | 95207 | 6.2% | 5.4%(+0.840)#502 | 5.3%(+0.936)#8,669 |
| 7. | 95204 | 6.2% | 5.4%(+0.773)#510 | 5.3%(+0.869)#8,861 |
| 8. | 95206 | 5.6% | 5.4%(+0.243)#628 | 5.3%(+0.340)#10,621 |
| 9. | 95219 | 5.3% | 5.4%(-0.049)#701 | 5.3%(+0.048)#11,636 |
| 10. | 95215 | 5.0% | 5.4%(-0.420)#795 | 5.3%(-0.323)#13,095 |
| 11. | 95209 | 4.2% | 5.4%(-1.13)#980 | 5.3%(-1.04)#16,112 |
| 12. | 95211 | 4.1% | 5.4%(-1.24)#999 | 5.3%(-1.15)#16,551 |
1
Common Questions
What are the Top 10 Zip Codes with the Highest Percentage of Population Employed in Food Preparation & Serving in Stockton, CA?
Top 10 Zip Codes with the Highest Percentage of Population Employed in Food Preparation & Serving in Stockton, CA are:
What zip code has the Highest Percentage of Population Employed in Food Preparation & Serving in Stockton, CA?
95210 has the Highest Percentage of Population Employed in Food Preparation & Serving in Stockton, CA with 7.4%.
What is the Percentage of Population Employed in Food Preparation & Serving in Stockton, CA?
Percentage of Population Employed in Food Preparation & Serving in Stockton is 6.1%.
What is the Percentage of Population Employed in Food Preparation & Serving in California?
Percentage of Population Employed in Food Preparation & Serving in California is 5.4%.
What is the Percentage of Population Employed in Food Preparation & Serving in the United States?
Percentage of Population Employed in Food Preparation & Serving in the United States is 5.3%.