Zip Codes with the Highest Percentage of Population Employed in Food Preparation & Serving in Twentynine Palms, CA
RELATED REPORTS & OPTIONS
Food Preparation & Serving
Twentynine Palms
Compare Zip Codes
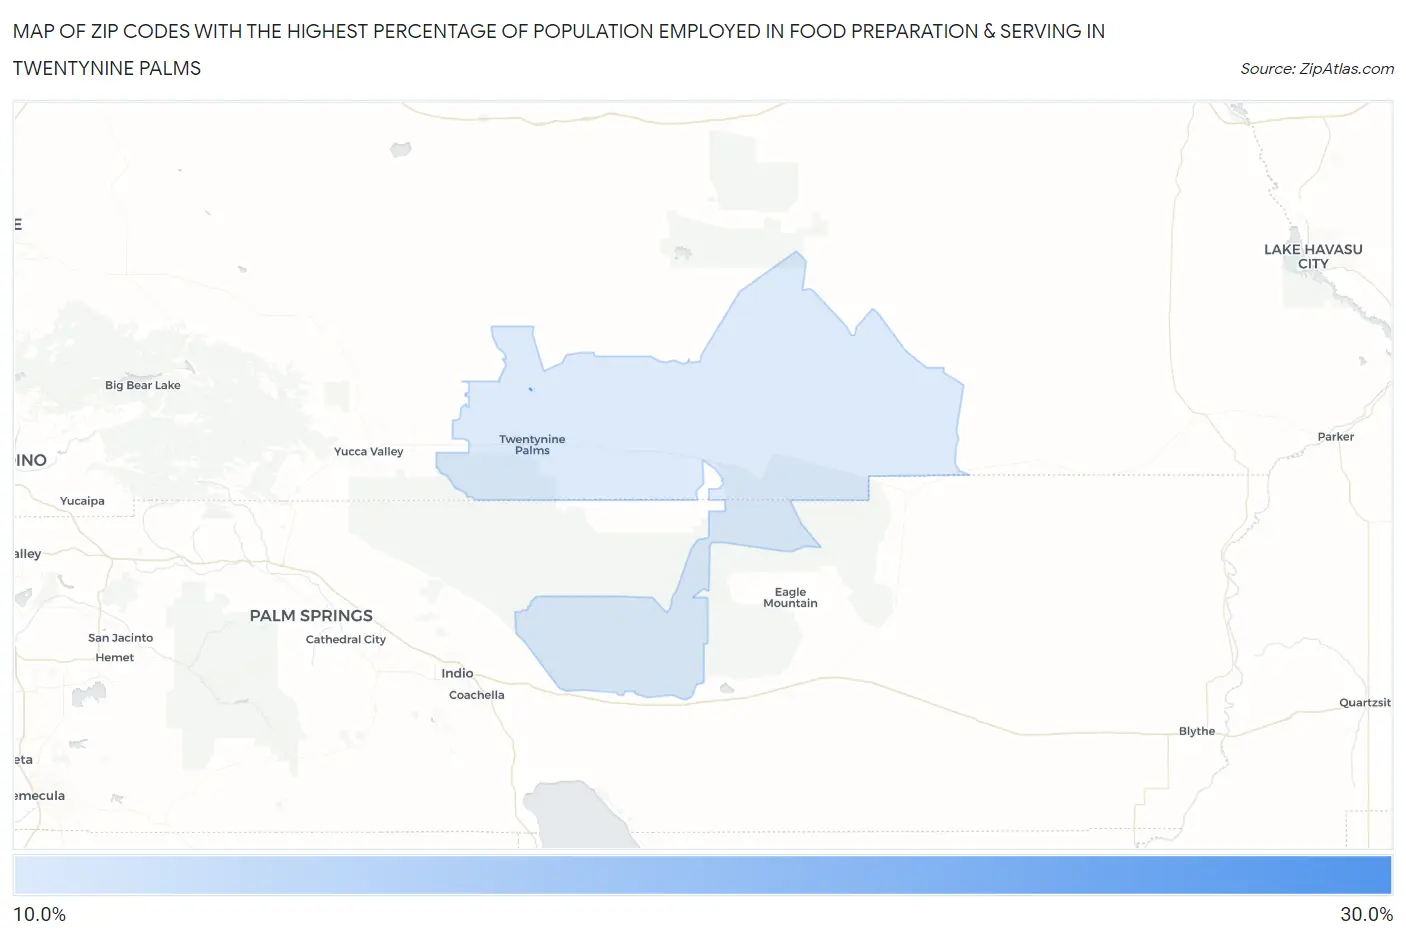
Map of Zip Codes with the Highest Percentage of Population Employed in Food Preparation & Serving in Twentynine Palms
10.7%
29.5%
Zip Codes with the Highest Percentage of Population Employed in Food Preparation & Serving in Twentynine Palms, CA
| Zip Code | % Employed | vs State | vs National | |
| 1. | 92278 | 29.5% | 5.4%(+24.2)#18 | 5.3%(+24.3)#222 |
| 2. | 92277 | 10.7% | 5.4%(+5.29)#111 | 5.3%(+5.39)#2,220 |
1
Common Questions
What are the Top Zip Codes with the Highest Percentage of Population Employed in Food Preparation & Serving in Twentynine Palms, CA?
Top Zip Codes with the Highest Percentage of Population Employed in Food Preparation & Serving in Twentynine Palms, CA are:
What zip code has the Highest Percentage of Population Employed in Food Preparation & Serving in Twentynine Palms, CA?
92278 has the Highest Percentage of Population Employed in Food Preparation & Serving in Twentynine Palms, CA with 29.5%.
What is the Percentage of Population Employed in Food Preparation & Serving in Twentynine Palms, CA?
Percentage of Population Employed in Food Preparation & Serving in Twentynine Palms is 10.9%.
What is the Percentage of Population Employed in Food Preparation & Serving in California?
Percentage of Population Employed in Food Preparation & Serving in California is 5.4%.
What is the Percentage of Population Employed in Food Preparation & Serving in the United States?
Percentage of Population Employed in Food Preparation & Serving in the United States is 5.3%.