Zip Codes with the Highest Percentage of Population with a Degree in Liberal Arts and History in Gilbert, AZ
RELATED REPORTS & OPTIONS
Liberal Arts and History
Gilbert
Compare Zip Codes
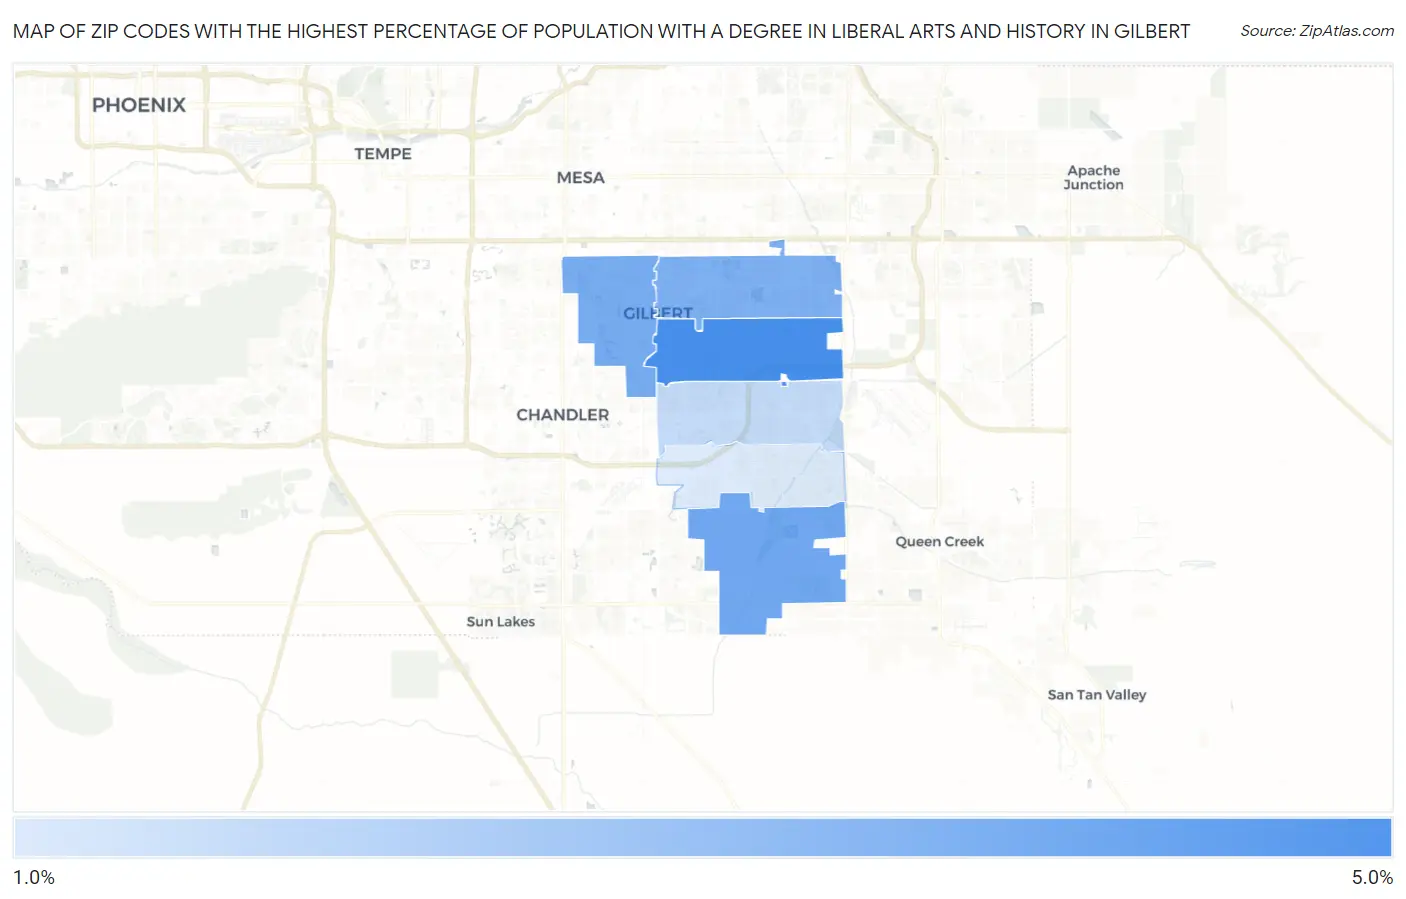
Map of Zip Codes with the Highest Percentage of Population with a Degree in Liberal Arts and History in Gilbert
1.3%
4.9%
Zip Codes with the Highest Percentage of Population with a Degree in Liberal Arts and History in Gilbert, AZ
| Zip Code | % Graduates | vs State | vs National | |
| 1. | 85296 | 4.9% | 4.3%(+0.606)#133 | 4.9%(-0.013)#11,787 |
| 2. | 85298 | 3.8% | 4.3%(-0.430)#191 | 4.9%(-1.05)#15,432 |
| 3. | 85233 | 3.7% | 4.3%(-0.547)#199 | 4.9%(-1.17)#15,865 |
| 4. | 85234 | 3.5% | 4.3%(-0.744)#206 | 4.9%(-1.36)#16,554 |
| 5. | 85295 | 1.9% | 4.3%(-2.39)#276 | 4.9%(-3.01)#21,702 |
| 6. | 85297 | 1.3% | 4.3%(-2.99)#294 | 4.9%(-3.61)#22,935 |
1
Common Questions
What are the Top 5 Zip Codes with the Highest Percentage of Population with a Degree in Liberal Arts and History in Gilbert, AZ?
Top 5 Zip Codes with the Highest Percentage of Population with a Degree in Liberal Arts and History in Gilbert, AZ are:
What zip code has the Highest Percentage of Population with a Degree in Liberal Arts and History in Gilbert, AZ?
85296 has the Highest Percentage of Population with a Degree in Liberal Arts and History in Gilbert, AZ with 4.9%.
What is the Percentage of Population with a Degree in Liberal Arts and History in Gilbert, AZ?
Percentage of Population with a Degree in Liberal Arts and History in Gilbert is 3.3%.
What is the Percentage of Population with a Degree in Liberal Arts and History in Arizona?
Percentage of Population with a Degree in Liberal Arts and History in Arizona is 4.3%.
What is the Percentage of Population with a Degree in Liberal Arts and History in the United States?
Percentage of Population with a Degree in Liberal Arts and History in the United States is 4.9%.