Zip Codes with the Highest Percentage of Population with a Degree in Liberal Arts and History in Prescott, AZ
RELATED REPORTS & OPTIONS
Liberal Arts and History
Prescott
Compare Zip Codes
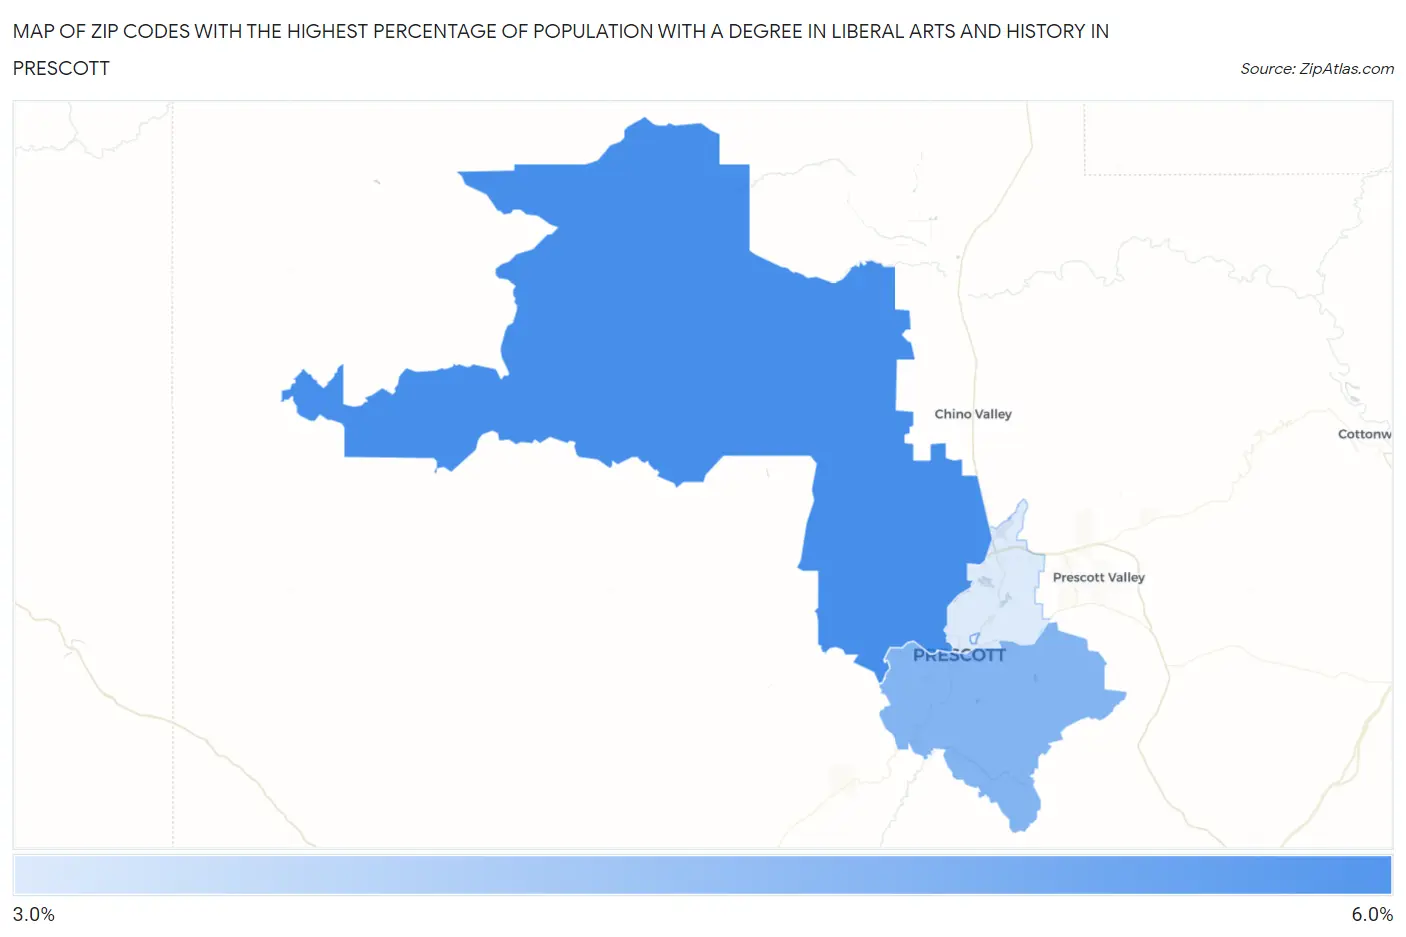
Map of Zip Codes with the Highest Percentage of Population with a Degree in Liberal Arts and History in Prescott
3.2%
5.2%
Zip Codes with the Highest Percentage of Population with a Degree in Liberal Arts and History in Prescott, AZ
| Zip Code | % Graduates | vs State | vs National | |
| 1. | 86305 | 5.2% | 4.3%(+0.912)#118 | 4.9%(+0.293)#10,827 |
| 2. | 86303 | 4.4% | 4.3%(+0.120)#155 | 4.9%(-0.498)#13,383 |
| 3. | 86301 | 3.2% | 4.3%(-1.05)#232 | 4.9%(-1.67)#17,652 |
1
Common Questions
What are the Top 3 Zip Codes with the Highest Percentage of Population with a Degree in Liberal Arts and History in Prescott, AZ?
Top 3 Zip Codes with the Highest Percentage of Population with a Degree in Liberal Arts and History in Prescott, AZ are:
What zip code has the Highest Percentage of Population with a Degree in Liberal Arts and History in Prescott, AZ?
86305 has the Highest Percentage of Population with a Degree in Liberal Arts and History in Prescott, AZ with 5.2%.
What is the Percentage of Population with a Degree in Liberal Arts and History in Prescott, AZ?
Percentage of Population with a Degree in Liberal Arts and History in Prescott is 4.3%.
What is the Percentage of Population with a Degree in Liberal Arts and History in Arizona?
Percentage of Population with a Degree in Liberal Arts and History in Arizona is 4.3%.
What is the Percentage of Population with a Degree in Liberal Arts and History in the United States?
Percentage of Population with a Degree in Liberal Arts and History in the United States is 4.9%.