Zip Codes with the Highest Percentage of Population with a Degree in Liberal Arts and History in Avondale, AZ
RELATED REPORTS & OPTIONS
Liberal Arts and History
Avondale
Compare Zip Codes
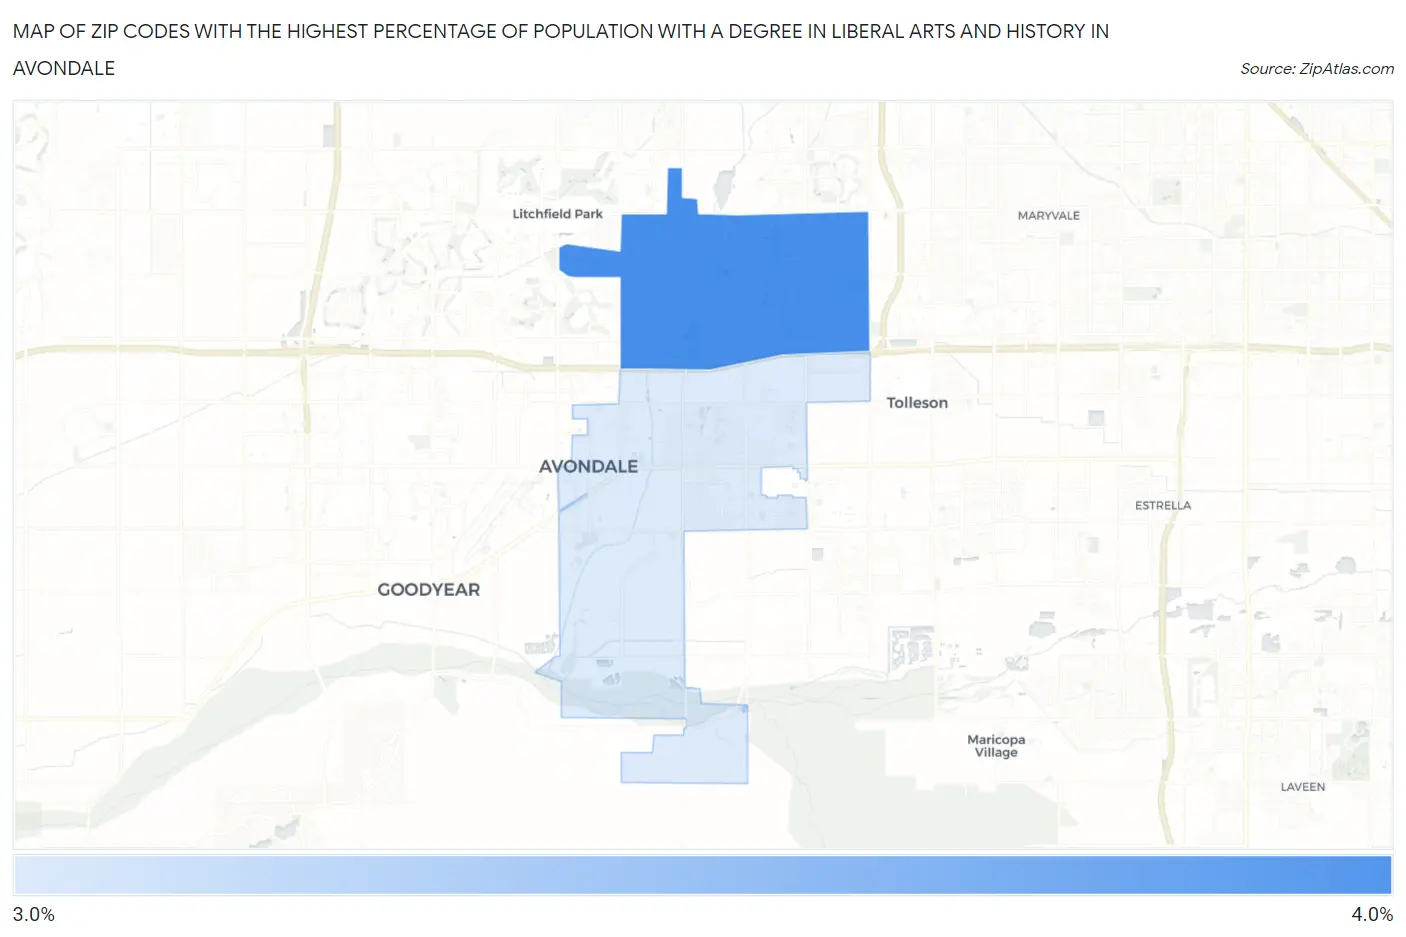
Map of Zip Codes with the Highest Percentage of Population with a Degree in Liberal Arts and History in Avondale
3.0%
3.2%
Zip Codes with the Highest Percentage of Population with a Degree in Liberal Arts and History in Avondale, AZ
| Zip Code | % Graduates | vs State | vs National | |
| 1. | 85392 | 3.2% | 4.3%(-1.08)#234 | 4.9%(-1.70)#17,760 |
| 2. | 85323 | 3.0% | 4.3%(-1.21)#237 | 4.9%(-1.82)#18,166 |
1
Common Questions
What are the Top Zip Codes with the Highest Percentage of Population with a Degree in Liberal Arts and History in Avondale, AZ?
Top Zip Codes with the Highest Percentage of Population with a Degree in Liberal Arts and History in Avondale, AZ are:
What zip code has the Highest Percentage of Population with a Degree in Liberal Arts and History in Avondale, AZ?
85392 has the Highest Percentage of Population with a Degree in Liberal Arts and History in Avondale, AZ with 3.2%.
What is the Percentage of Population with a Degree in Liberal Arts and History in Avondale, AZ?
Percentage of Population with a Degree in Liberal Arts and History in Avondale is 3.1%.
What is the Percentage of Population with a Degree in Liberal Arts and History in Arizona?
Percentage of Population with a Degree in Liberal Arts and History in Arizona is 4.3%.
What is the Percentage of Population with a Degree in Liberal Arts and History in the United States?
Percentage of Population with a Degree in Liberal Arts and History in the United States is 4.9%.