Zip Codes with the Highest Percentage of Population Employed in Administrative & Support Services in Chandler, AZ
RELATED REPORTS & OPTIONS
Administrative & Support Services
Chandler
Compare Zip Codes
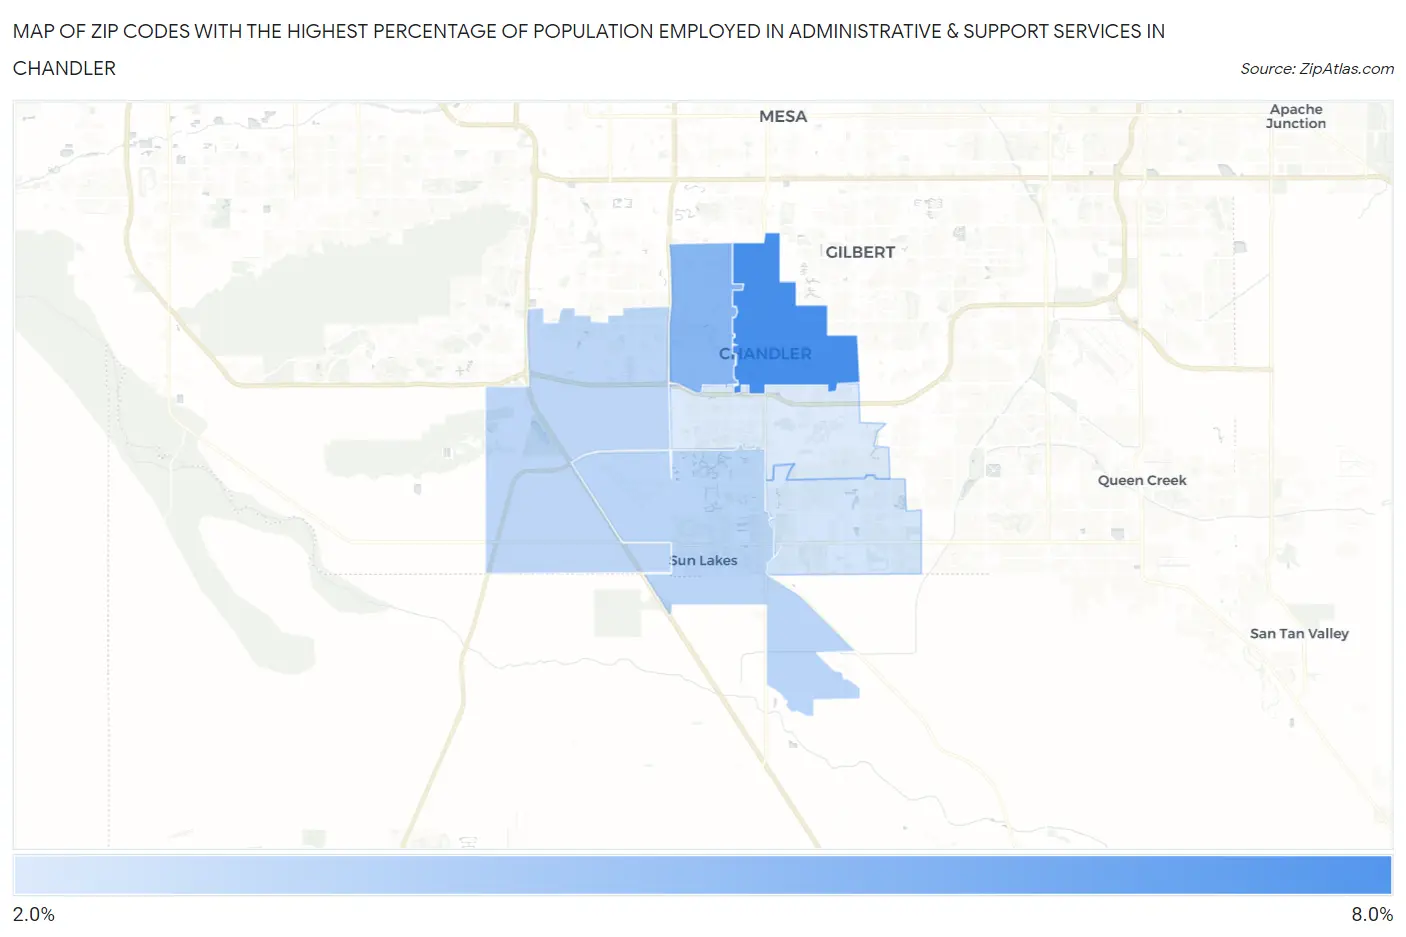
Map of Zip Codes with the Highest Percentage of Population Employed in Administrative & Support Services in Chandler
2.5%
6.6%
Zip Codes with the Highest Percentage of Population Employed in Administrative & Support Services in Chandler, AZ
| Zip Code | % Employed | vs State | vs National | |
| 1. | 85225 | 6.6% | 5.4%(+1.25)#87 | 4.1%(+2.45)#3,766 |
| 2. | 85224 | 4.8% | 5.4%(-0.518)#155 | 4.1%(+0.686)#7,604 |
| 3. | 85248 | 3.4% | 5.4%(-1.94)#235 | 4.1%(-0.733)#13,358 |
| 4. | 85226 | 3.3% | 5.4%(-2.01)#239 | 4.1%(-0.806)#13,715 |
| 5. | 85249 | 2.8% | 5.4%(-2.58)#264 | 4.1%(-1.37)#16,694 |
| 6. | 85286 | 2.5% | 5.4%(-2.85)#277 | 4.1%(-1.65)#18,131 |
1
Common Questions
What are the Top 5 Zip Codes with the Highest Percentage of Population Employed in Administrative & Support Services in Chandler, AZ?
Top 5 Zip Codes with the Highest Percentage of Population Employed in Administrative & Support Services in Chandler, AZ are:
What zip code has the Highest Percentage of Population Employed in Administrative & Support Services in Chandler, AZ?
85225 has the Highest Percentage of Population Employed in Administrative & Support Services in Chandler, AZ with 6.6%.
What is the Percentage of Population Employed in Administrative & Support Services in Chandler, AZ?
Percentage of Population Employed in Administrative & Support Services in Chandler is 4.3%.
What is the Percentage of Population Employed in Administrative & Support Services in Arizona?
Percentage of Population Employed in Administrative & Support Services in Arizona is 5.4%.
What is the Percentage of Population Employed in Administrative & Support Services in the United States?
Percentage of Population Employed in Administrative & Support Services in the United States is 4.1%.