Zip Codes with the Highest Percentage of Population Employed in Administrative & Support Services in San Luis, AZ
RELATED REPORTS & OPTIONS
Administrative & Support Services
San Luis
Compare Zip Codes
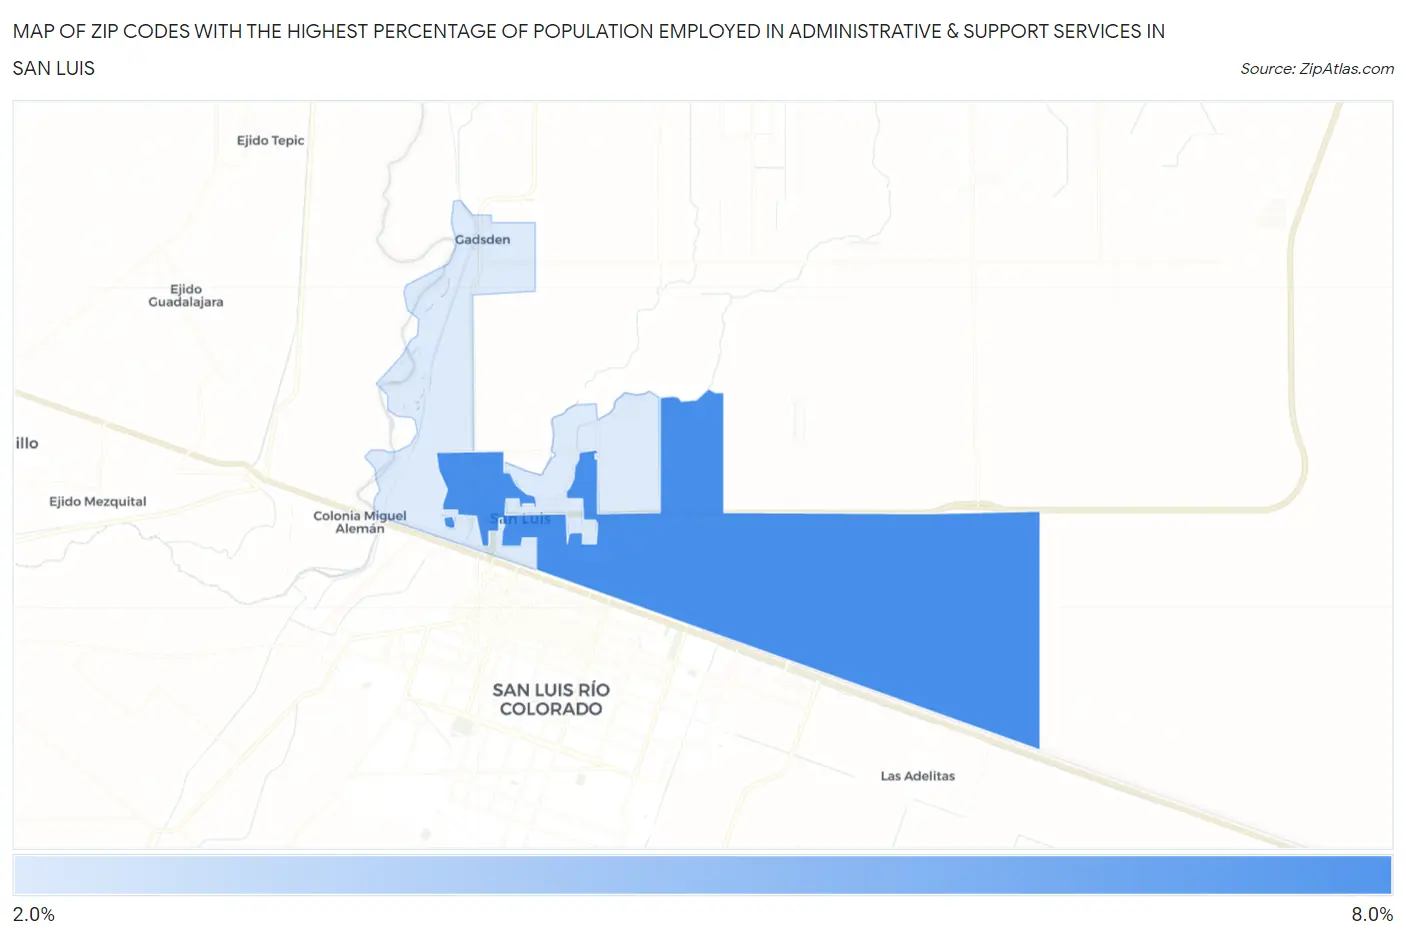
Map of Zip Codes with the Highest Percentage of Population Employed in Administrative & Support Services in San Luis
2.9%
6.3%
Zip Codes with the Highest Percentage of Population Employed in Administrative & Support Services in San Luis, AZ
| Zip Code | % Employed | vs State | vs National | |
| 1. | 85349 | 6.3% | 5.4%(+0.946)#97 | 4.1%(+2.15)#4,239 |
| 2. | 85336 | 2.9% | 5.4%(-2.47)#260 | 4.1%(-1.27)#16,080 |
1
Common Questions
What are the Top Zip Codes with the Highest Percentage of Population Employed in Administrative & Support Services in San Luis, AZ?
Top Zip Codes with the Highest Percentage of Population Employed in Administrative & Support Services in San Luis, AZ are:
What zip code has the Highest Percentage of Population Employed in Administrative & Support Services in San Luis, AZ?
85349 has the Highest Percentage of Population Employed in Administrative & Support Services in San Luis, AZ with 6.3%.
What is the Percentage of Population Employed in Administrative & Support Services in San Luis, AZ?
Percentage of Population Employed in Administrative & Support Services in San Luis is 5.4%.
What is the Percentage of Population Employed in Administrative & Support Services in Arizona?
Percentage of Population Employed in Administrative & Support Services in Arizona is 5.4%.
What is the Percentage of Population Employed in Administrative & Support Services in the United States?
Percentage of Population Employed in Administrative & Support Services in the United States is 4.1%.