Zip Codes with the Highest Percentage of Population Employed in Administrative & Support Services in Sierra Vista, AZ
RELATED REPORTS & OPTIONS
Administrative & Support Services
Sierra Vista
Compare Zip Codes
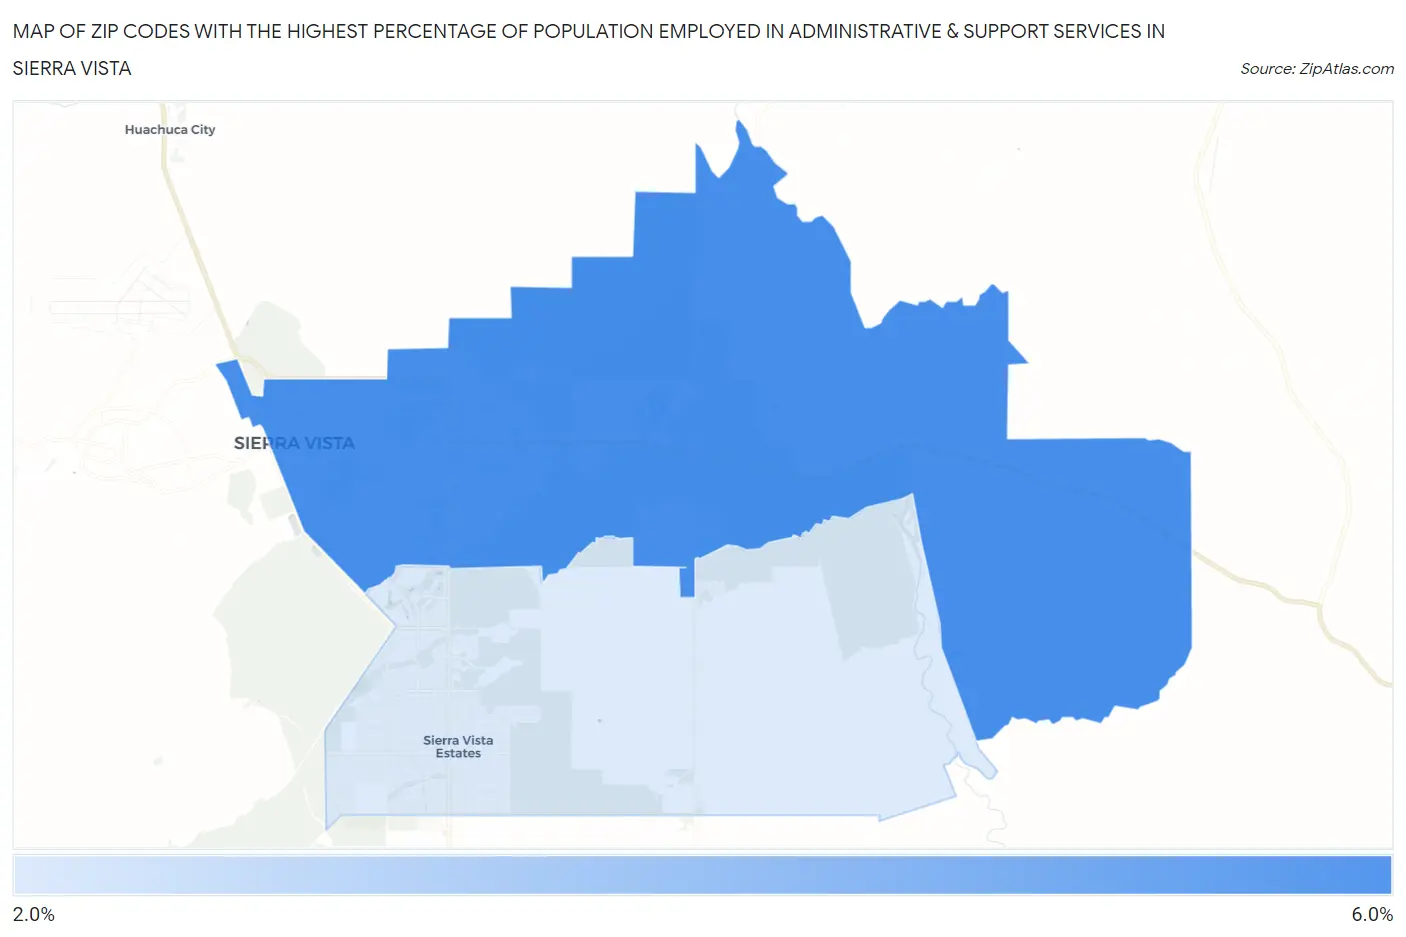
Map of Zip Codes with the Highest Percentage of Population Employed in Administrative & Support Services in Sierra Vista
2.4%
5.8%
Zip Codes with the Highest Percentage of Population Employed in Administrative & Support Services in Sierra Vista, AZ
| Zip Code | % Employed | vs State | vs National | |
| 1. | 85635 | 5.8% | 5.4%(+0.441)#117 | 4.1%(+1.65)#5,158 |
| 2. | 85650 | 2.4% | 5.4%(-2.91)#279 | 4.1%(-1.70)#18,415 |
1
Common Questions
What are the Top Zip Codes with the Highest Percentage of Population Employed in Administrative & Support Services in Sierra Vista, AZ?
Top Zip Codes with the Highest Percentage of Population Employed in Administrative & Support Services in Sierra Vista, AZ are:
What zip code has the Highest Percentage of Population Employed in Administrative & Support Services in Sierra Vista, AZ?
85635 has the Highest Percentage of Population Employed in Administrative & Support Services in Sierra Vista, AZ with 5.8%.
What is the Percentage of Population Employed in Administrative & Support Services in Sierra Vista, AZ?
Percentage of Population Employed in Administrative & Support Services in Sierra Vista is 5.3%.
What is the Percentage of Population Employed in Administrative & Support Services in Arizona?
Percentage of Population Employed in Administrative & Support Services in Arizona is 5.4%.
What is the Percentage of Population Employed in Administrative & Support Services in the United States?
Percentage of Population Employed in Administrative & Support Services in the United States is 4.1%.