Zip Codes with the Highest Percentage of Population Employed in Administrative & Support Services in Eureka Springs, AR
RELATED REPORTS & OPTIONS
Administrative & Support Services
Eureka Springs
Compare Zip Codes
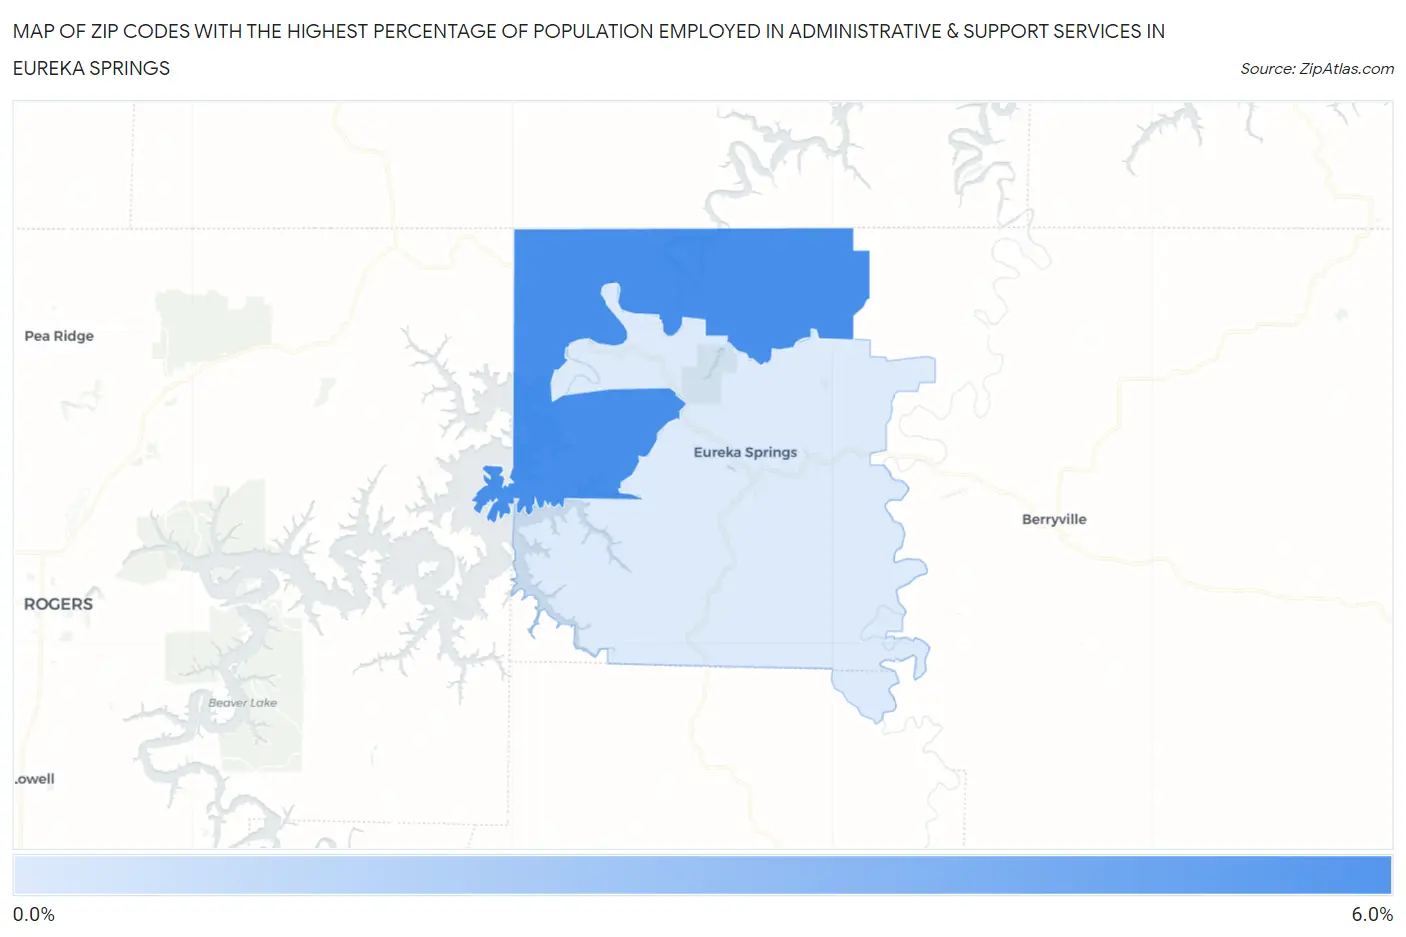
Map of Zip Codes with the Highest Percentage of Population Employed in Administrative & Support Services in Eureka Springs
0.91%
5.3%
Zip Codes with the Highest Percentage of Population Employed in Administrative & Support Services in Eureka Springs, AR
| Zip Code | % Employed | vs State | vs National | |
| 1. | 72631 | 5.3% | 3.4%(+1.89)#80 | 4.1%(+1.17)#6,275 |
| 2. | 72632 | 0.91% | 3.4%(-2.52)#349 | 4.1%(-3.24)#24,793 |
1
Common Questions
What are the Top Zip Codes with the Highest Percentage of Population Employed in Administrative & Support Services in Eureka Springs, AR?
Top Zip Codes with the Highest Percentage of Population Employed in Administrative & Support Services in Eureka Springs, AR are:
What zip code has the Highest Percentage of Population Employed in Administrative & Support Services in Eureka Springs, AR?
72631 has the Highest Percentage of Population Employed in Administrative & Support Services in Eureka Springs, AR with 5.3%.
What is the Percentage of Population Employed in Administrative & Support Services in Eureka Springs, AR?
Percentage of Population Employed in Administrative & Support Services in Eureka Springs is 0.86%.
What is the Percentage of Population Employed in Administrative & Support Services in Arkansas?
Percentage of Population Employed in Administrative & Support Services in Arkansas is 3.4%.
What is the Percentage of Population Employed in Administrative & Support Services in the United States?
Percentage of Population Employed in Administrative & Support Services in the United States is 4.1%.