Zip Codes with the Highest Percentage of Population Employed in Installation, Maintenance & Repair in Eureka Springs, AR
RELATED REPORTS & OPTIONS
Installation, Maintenance & Repair
Eureka Springs
Compare Zip Codes
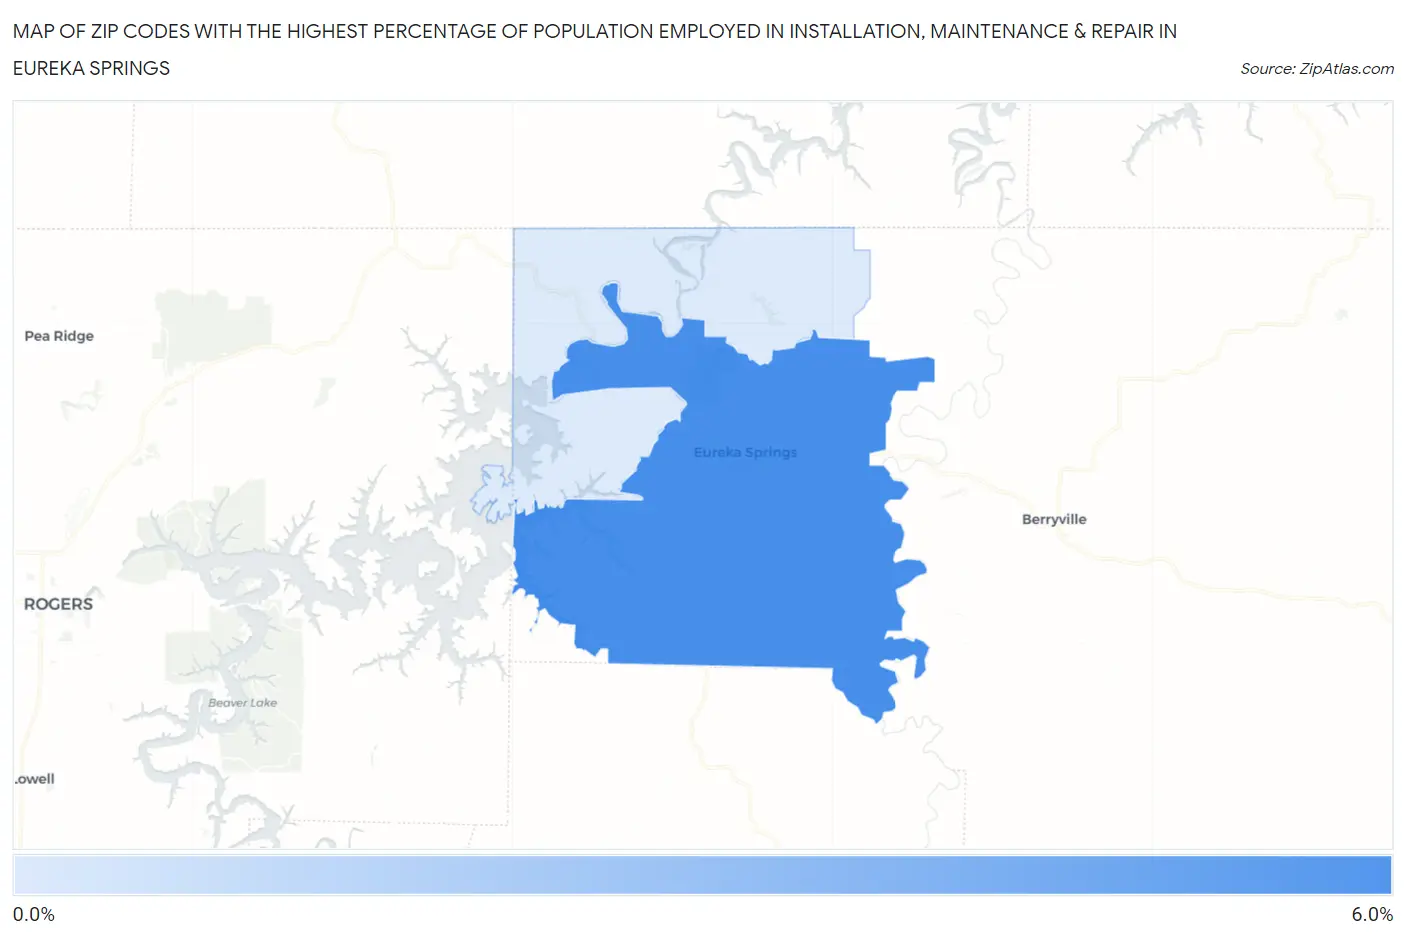
Map of Zip Codes with the Highest Percentage of Population Employed in Installation, Maintenance & Repair in Eureka Springs
0.57%
5.9%
Zip Codes with the Highest Percentage of Population Employed in Installation, Maintenance & Repair in Eureka Springs, AR
| Zip Code | % Employed | vs State | vs National | |
| 1. | 72632 | 5.9% | 3.8%(+2.14)#159 | 3.1%(+2.87)#6,267 |
| 2. | 72631 | 0.57% | 3.8%(-3.23)#440 | 3.1%(-2.50)#27,080 |
1
Common Questions
What are the Top Zip Codes with the Highest Percentage of Population Employed in Installation, Maintenance & Repair in Eureka Springs, AR?
Top Zip Codes with the Highest Percentage of Population Employed in Installation, Maintenance & Repair in Eureka Springs, AR are:
What zip code has the Highest Percentage of Population Employed in Installation, Maintenance & Repair in Eureka Springs, AR?
72632 has the Highest Percentage of Population Employed in Installation, Maintenance & Repair in Eureka Springs, AR with 5.9%.
What is the Percentage of Population Employed in Installation, Maintenance & Repair in Eureka Springs, AR?
Percentage of Population Employed in Installation, Maintenance & Repair in Eureka Springs is 1.2%.
What is the Percentage of Population Employed in Installation, Maintenance & Repair in Arkansas?
Percentage of Population Employed in Installation, Maintenance & Repair in Arkansas is 3.8%.
What is the Percentage of Population Employed in Installation, Maintenance & Repair in the United States?
Percentage of Population Employed in Installation, Maintenance & Repair in the United States is 3.1%.