Zip Codes with the Highest Percentage of Population Employed in Administrative & Support Services in North Little Rock, AR
RELATED REPORTS & OPTIONS
Administrative & Support Services
North Little Rock
Compare Zip Codes
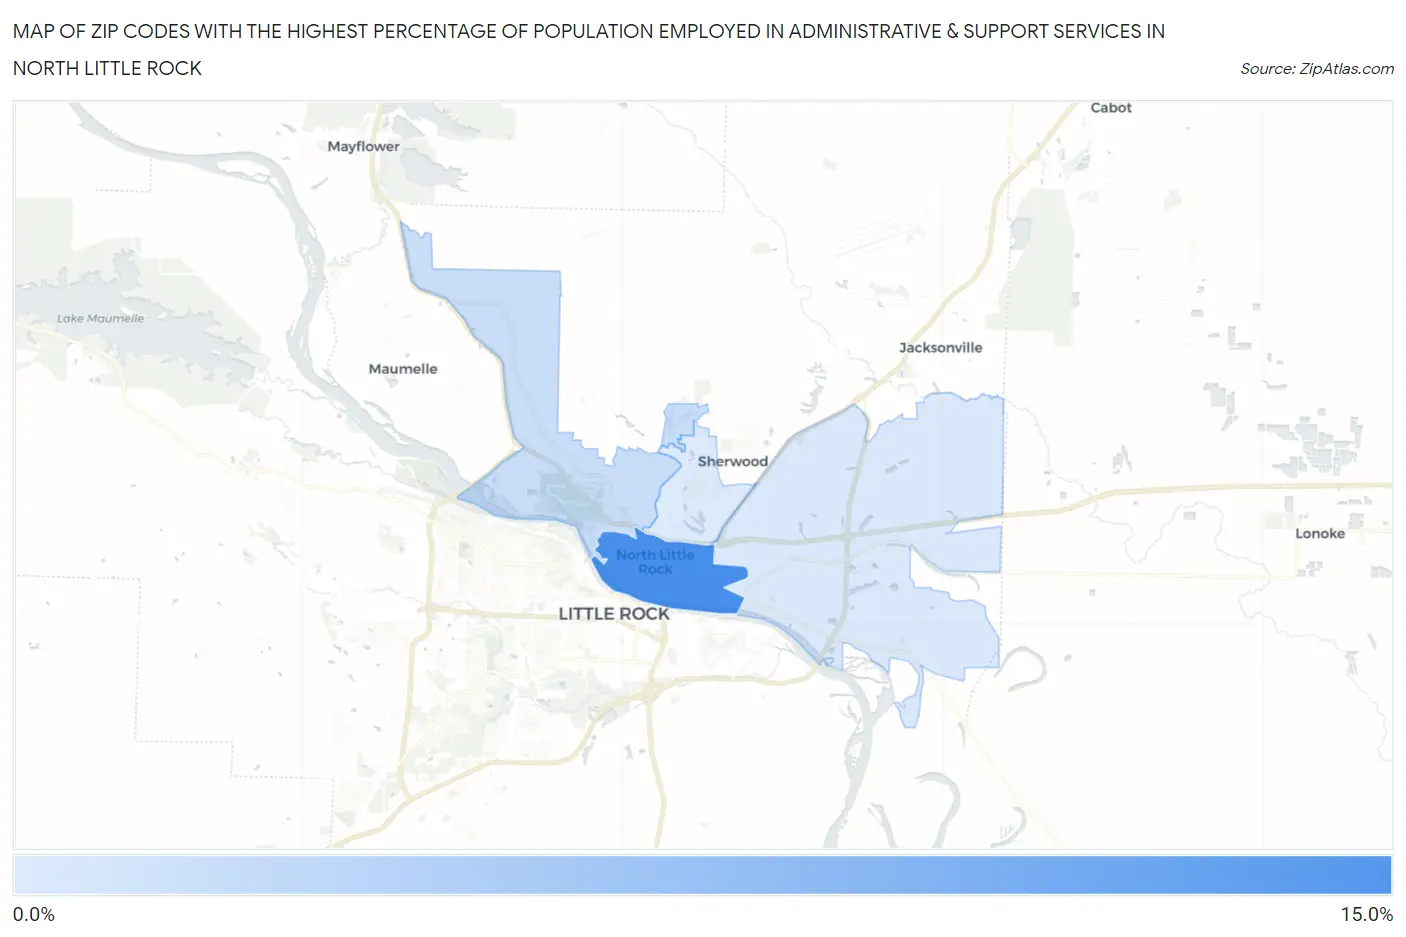
Map of Zip Codes with the Highest Percentage of Population Employed in Administrative & Support Services in North Little Rock
2.6%
11.6%
Zip Codes with the Highest Percentage of Population Employed in Administrative & Support Services in North Little Rock, AR
| Zip Code | % Employed | vs State | vs National | |
| 1. | 72114 | 11.6% | 3.4%(+8.21)#19 | 4.1%(+7.49)#904 |
| 2. | 72118 | 3.8% | 3.4%(+0.371)#158 | 4.1%(-0.349)#11,521 |
| 3. | 72117 | 2.7% | 3.4%(-0.749)#226 | 4.1%(-1.47)#17,181 |
| 4. | 72116 | 2.6% | 3.4%(-0.839)#236 | 4.1%(-1.56)#17,654 |
1
Common Questions
What are the Top 3 Zip Codes with the Highest Percentage of Population Employed in Administrative & Support Services in North Little Rock, AR?
Top 3 Zip Codes with the Highest Percentage of Population Employed in Administrative & Support Services in North Little Rock, AR are:
What zip code has the Highest Percentage of Population Employed in Administrative & Support Services in North Little Rock, AR?
72114 has the Highest Percentage of Population Employed in Administrative & Support Services in North Little Rock, AR with 11.6%.
What is the Percentage of Population Employed in Administrative & Support Services in North Little Rock, AR?
Percentage of Population Employed in Administrative & Support Services in North Little Rock is 4.5%.
What is the Percentage of Population Employed in Administrative & Support Services in Arkansas?
Percentage of Population Employed in Administrative & Support Services in Arkansas is 3.4%.
What is the Percentage of Population Employed in Administrative & Support Services in the United States?
Percentage of Population Employed in Administrative & Support Services in the United States is 4.1%.