Zip Codes with the Most Immigrants from Latin America in Eureka Springs, AR
RELATED REPORTS & OPTIONS
Latin America
Eureka Springs
Compare Zip Codes
Map of Zip Codes with the Most Immigrants from Latin America in Eureka Springs
6
17
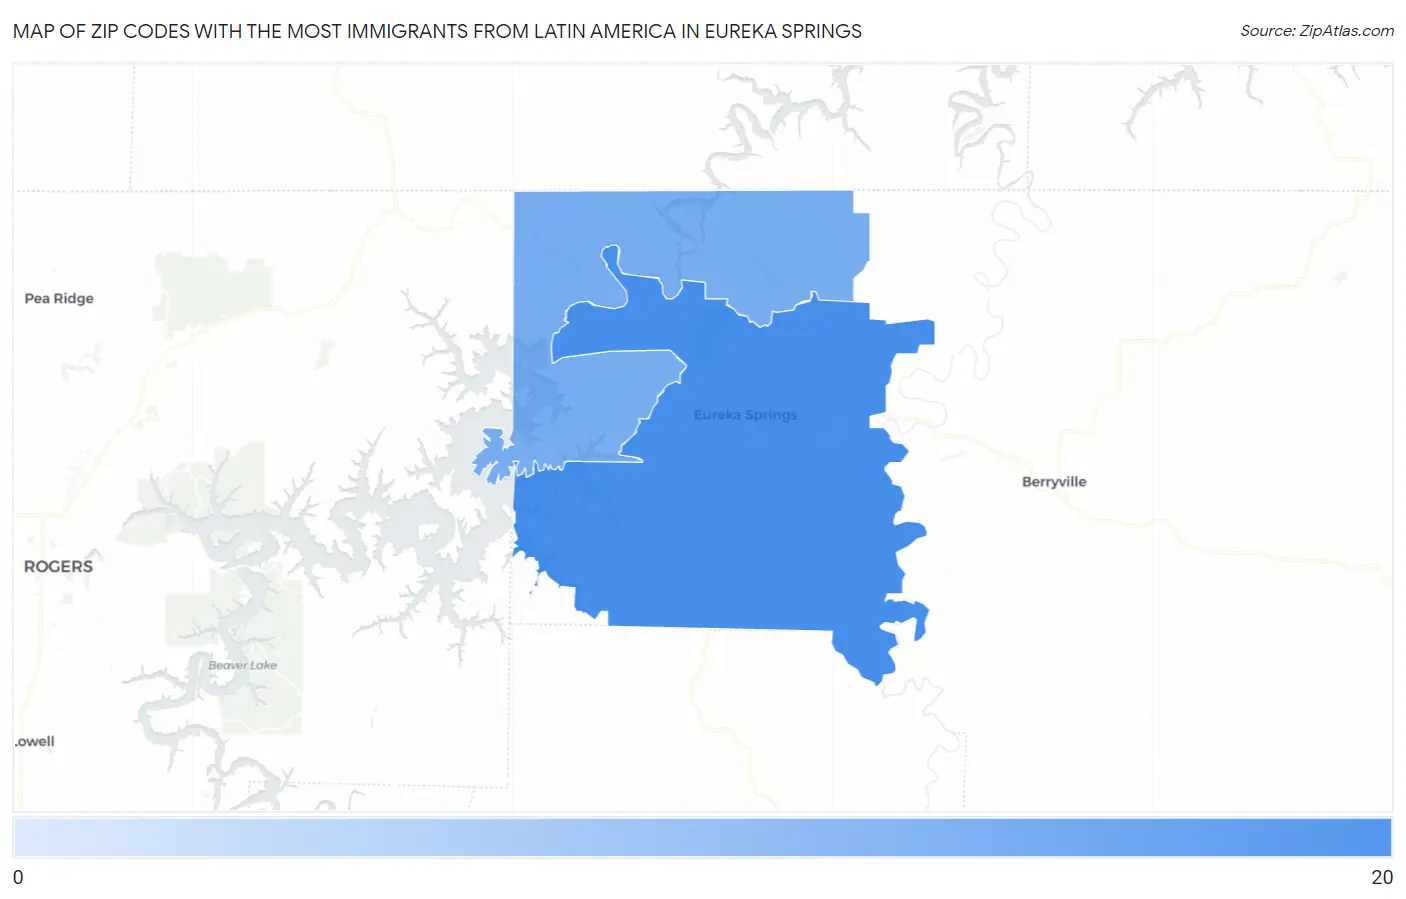
Zip Codes with the Most Immigrants from Latin America in Eureka Springs, AR
| Zip Code | Latin America | vs State | vs National | |
| 1. | 72632 | 17 | 93,350(0.02%)#205 | 22,649,518(0.00%)#16,397 |
| 2. | 72631 | 6 | 93,350(0.01%)#250 | 22,649,518(0.00%)#18,809 |
1
Common Questions
What are the Top Zip Codes with the Most Immigrants from Latin America in Eureka Springs, AR?
Top Zip Codes with the Most Immigrants from Latin America in Eureka Springs, AR are:
What zip code has the Most Immigrants from Latin America in Eureka Springs, AR?
72632 has the Most Immigrants from Latin America in Eureka Springs, AR with 17.
What is the Total Immigrants from Latin America in Eureka Springs, AR?
Total Immigrants from Latin America in Eureka Springs is 7.
What is the Total Immigrants from Latin America in Arkansas?
Total Immigrants from Latin America in Arkansas is 93,350.
What is the Total Immigrants from Latin America in the United States?
Total Immigrants from Latin America in the United States is 22,649,518.