Zip Codes with the Highest Percentage of Population Employed in Administrative & Support Services in Benton, AR
RELATED REPORTS & OPTIONS
Administrative & Support Services
Benton
Compare Zip Codes
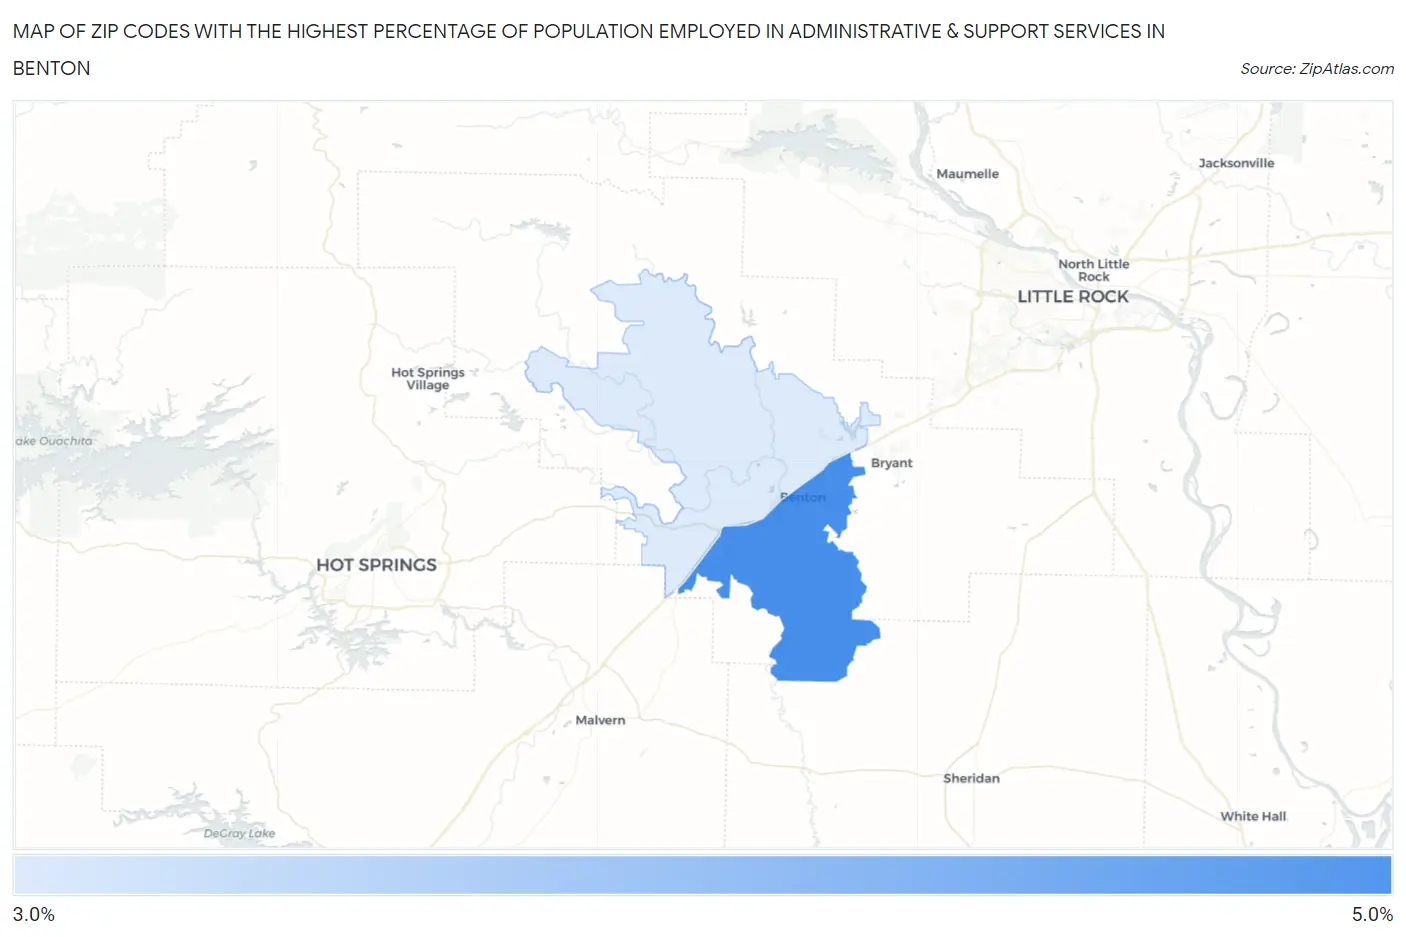
Map of Zip Codes with the Highest Percentage of Population Employed in Administrative & Support Services in Benton
3.5%
4.7%
Zip Codes with the Highest Percentage of Population Employed in Administrative & Support Services in Benton, AR
| Zip Code | % Employed | vs State | vs National | |
| 1. | 72015 | 4.7% | 3.4%(+1.23)#107 | 4.1%(+0.505)#8,173 |
| 2. | 72019 | 3.5% | 3.4%(+0.085)#178 | 4.1%(-0.635)#12,885 |
1
Common Questions
What are the Top Zip Codes with the Highest Percentage of Population Employed in Administrative & Support Services in Benton, AR?
Top Zip Codes with the Highest Percentage of Population Employed in Administrative & Support Services in Benton, AR are:
What zip code has the Highest Percentage of Population Employed in Administrative & Support Services in Benton, AR?
72015 has the Highest Percentage of Population Employed in Administrative & Support Services in Benton, AR with 4.7%.
What is the Percentage of Population Employed in Administrative & Support Services in Benton, AR?
Percentage of Population Employed in Administrative & Support Services in Benton is 5.2%.
What is the Percentage of Population Employed in Administrative & Support Services in Arkansas?
Percentage of Population Employed in Administrative & Support Services in Arkansas is 3.4%.
What is the Percentage of Population Employed in Administrative & Support Services in the United States?
Percentage of Population Employed in Administrative & Support Services in the United States is 4.1%.