Eureka Springs, AR Map & Demographics
Eureka Springs Map
Eureka Springs Overview
$31,355
PER CAPITA INCOME
$66,500
AVG FAMILY INCOME
$40,972
AVG HOUSEHOLD INCOME
14.2%
WAGE / INCOME GAP [ % ]
85.8¢/ $1
WAGE / INCOME GAP [ $ ]
0.50
INEQUALITY / GINI INDEX
2,053
TOTAL POPULATION
1,024
MALE POPULATION
1,029
FEMALE POPULATION
99.51
MALES / 100 FEMALES
100.49
FEMALES / 100 MALES
52.0
MEDIAN AGE
2.9
AVG FAMILY SIZE
2.1
AVG HOUSEHOLD SIZE
821
LABOR FORCE [ PEOPLE ]
46.6%
PERCENT IN LABOR FORCE
1.1%
UNEMPLOYMENT RATE
Eureka Springs Area Codes
Income in Eureka Springs
Income Overview in Eureka Springs
Per Capita Income in Eureka Springs is $31,355, while median incomes of families and households are $66,500 and $40,972 respectively.
| Characteristic | Number | Measure |
| Per Capita Income | 2,053 | $31,355 |
| Median Family Income | 506 | $66,500 |
| Mean Family Income | 506 | $95,567 |
| Median Household Income | 933 | $40,972 |
| Mean Household Income | 933 | $68,412 |
| Income Deficit | 506 | $0 |
| Wage / Income Gap (%) | 2,053 | 14.24% |
| Wage / Income Gap ($) | 2,053 | 85.76¢ per $1 |
| Gini / Inequality Index | 2,053 | 0.50 |
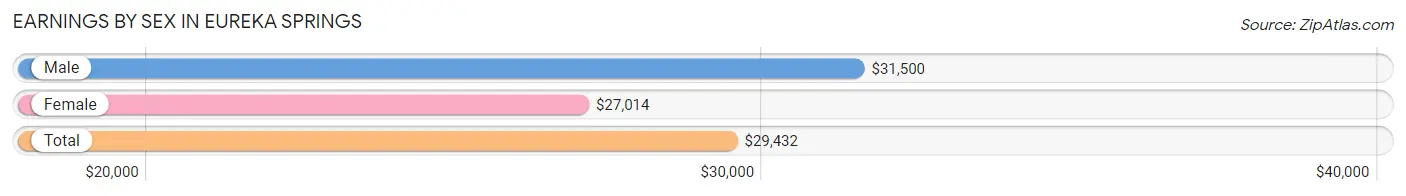
Earnings by Sex in Eureka Springs
Average Earnings in Eureka Springs are $29,432, $31,500 for men and $27,014 for women, a difference of 14.2%.
| Sex | Number | Average Earnings |
| Male | 498 (54.1%) | $31,500 |
| Female | 423 (45.9%) | $27,014 |
| Total | 921 (100.0%) | $29,432 |
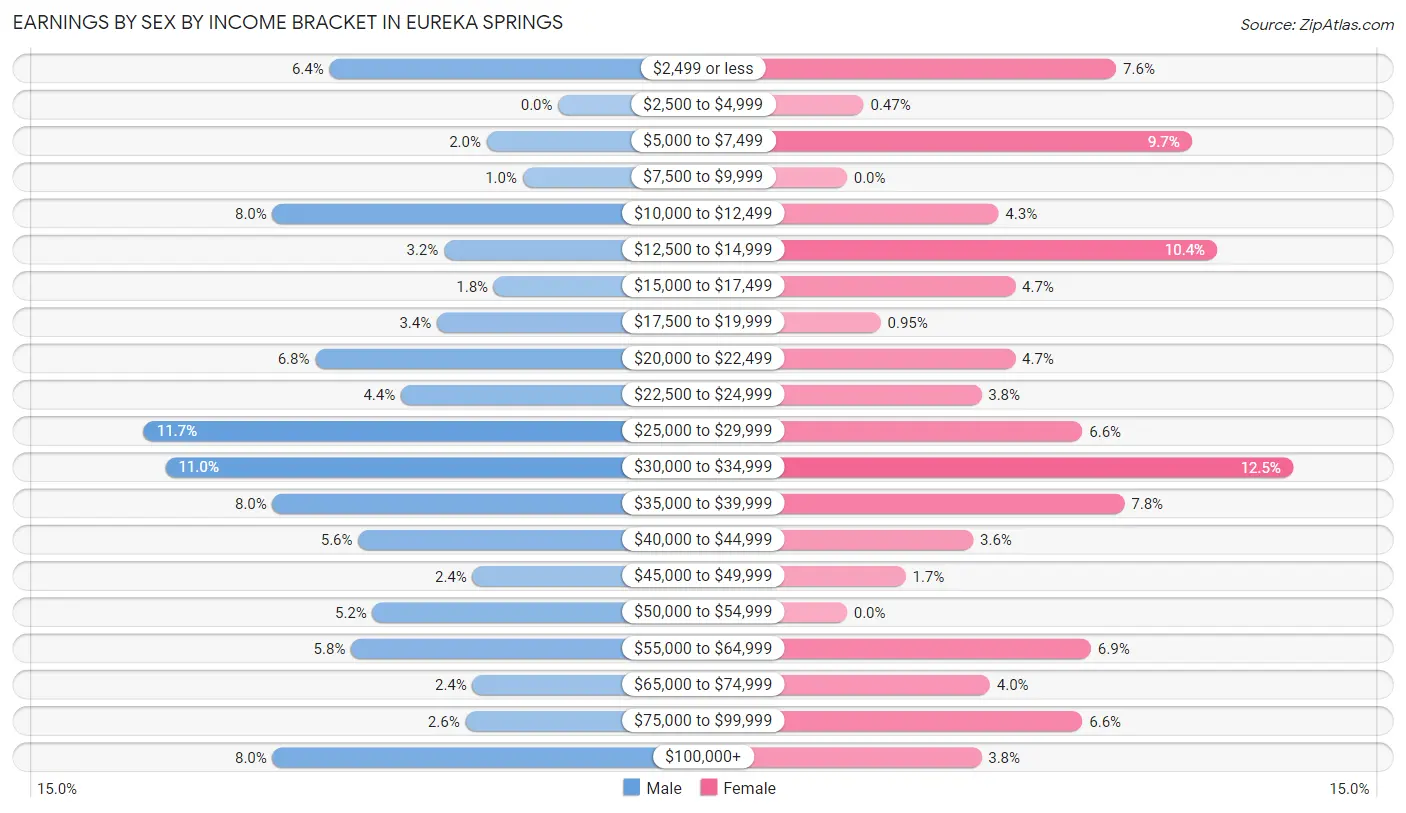
Earnings by Sex by Income Bracket in Eureka Springs
The most common earnings brackets in Eureka Springs are $25,000 to $29,999 for men (58 | 11.7%) and $30,000 to $34,999 for women (53 | 12.5%).
| Income | Male | Female |
| $2,499 or less | 32 (6.4%) | 32 (7.6%) |
| $2,500 to $4,999 | 0 (0.0%) | 2 (0.5%) |
| $5,000 to $7,499 | 10 (2.0%) | 41 (9.7%) |
| $7,500 to $9,999 | 5 (1.0%) | 0 (0.0%) |
| $10,000 to $12,499 | 40 (8.0%) | 18 (4.3%) |
| $12,500 to $14,999 | 16 (3.2%) | 44 (10.4%) |
| $15,000 to $17,499 | 9 (1.8%) | 20 (4.7%) |
| $17,500 to $19,999 | 17 (3.4%) | 4 (0.9%) |
| $20,000 to $22,499 | 34 (6.8%) | 20 (4.7%) |
| $22,500 to $24,999 | 22 (4.4%) | 16 (3.8%) |
| $25,000 to $29,999 | 58 (11.7%) | 28 (6.6%) |
| $30,000 to $34,999 | 55 (11.0%) | 53 (12.5%) |
| $35,000 to $39,999 | 40 (8.0%) | 33 (7.8%) |
| $40,000 to $44,999 | 28 (5.6%) | 15 (3.5%) |
| $45,000 to $49,999 | 12 (2.4%) | 7 (1.7%) |
| $50,000 to $54,999 | 26 (5.2%) | 0 (0.0%) |
| $55,000 to $64,999 | 29 (5.8%) | 29 (6.9%) |
| $65,000 to $74,999 | 12 (2.4%) | 17 (4.0%) |
| $75,000 to $99,999 | 13 (2.6%) | 28 (6.6%) |
| $100,000+ | 40 (8.0%) | 16 (3.8%) |
| Total | 498 (100.0%) | 423 (100.0%) |
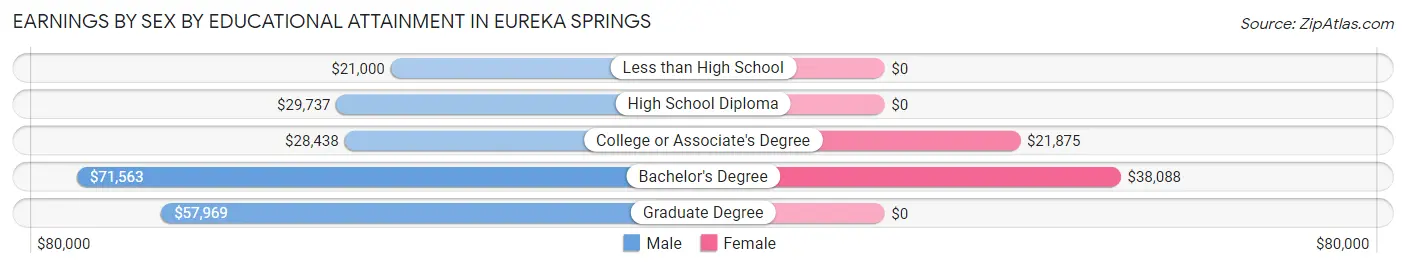
Earnings by Sex by Educational Attainment in Eureka Springs
Average earnings in Eureka Springs are $33,454 for men and $29,375 for women, a difference of 12.2%. Men with an educational attainment of bachelor's degree enjoy the highest average annual earnings of $71,563, while those with less than high school education earn the least with $21,000. Women with an educational attainment of bachelor's degree earn the most with the average annual earnings of $38,088, while those with college or associate's degree education have the smallest earnings of $21,875.
| Educational Attainment | Male Income | Female Income |
| Less than High School | $21,000 | $0 |
| High School Diploma | $29,737 | $0 |
| College or Associate's Degree | $28,438 | $21,875 |
| Bachelor's Degree | $71,563 | $38,088 |
| Graduate Degree | $57,969 | $0 |
| Total | $33,454 | $29,375 |
Family Income in Eureka Springs
Family Income Brackets in Eureka Springs
According to the Eureka Springs family income data, there are 86 families falling into the $100,000 to $149,999 income range, which is the most common income bracket and makes up 17.0% of all families. Conversely, the $10,000 to $14,999 income bracket is the least frequent group with only 3 families (0.6%) belonging to this category.
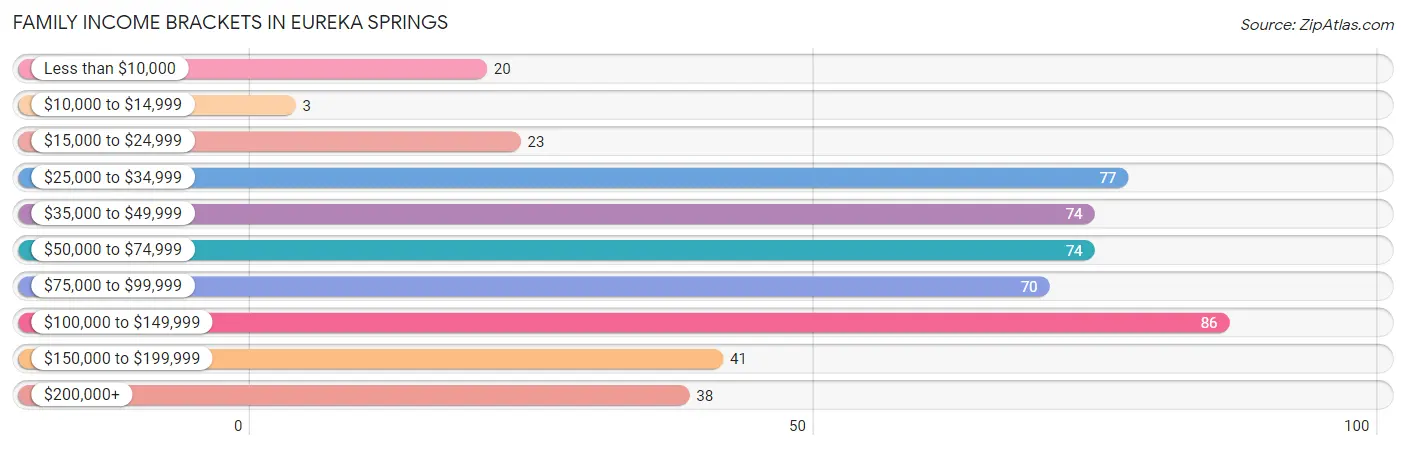
| Income Bracket | # Families | % Families |
| Less than $10,000 | 20 | 4.0% |
| $10,000 to $14,999 | 3 | 0.6% |
| $15,000 to $24,999 | 23 | 4.5% |
| $25,000 to $34,999 | 77 | 15.2% |
| $35,000 to $49,999 | 74 | 14.6% |
| $50,000 to $74,999 | 74 | 14.6% |
| $75,000 to $99,999 | 70 | 13.8% |
| $100,000 to $149,999 | 86 | 17.0% |
| $150,000 to $199,999 | 41 | 8.1% |
| $200,000+ | 38 | 7.5% |
Family Income by Famaliy Size in Eureka Springs
2-person families (363 | 71.7%) account for the highest median family income in Eureka Springs with $74,688 per family, while 2-person families (363 | 71.7%) have the highest median income of $37,344 per family member.
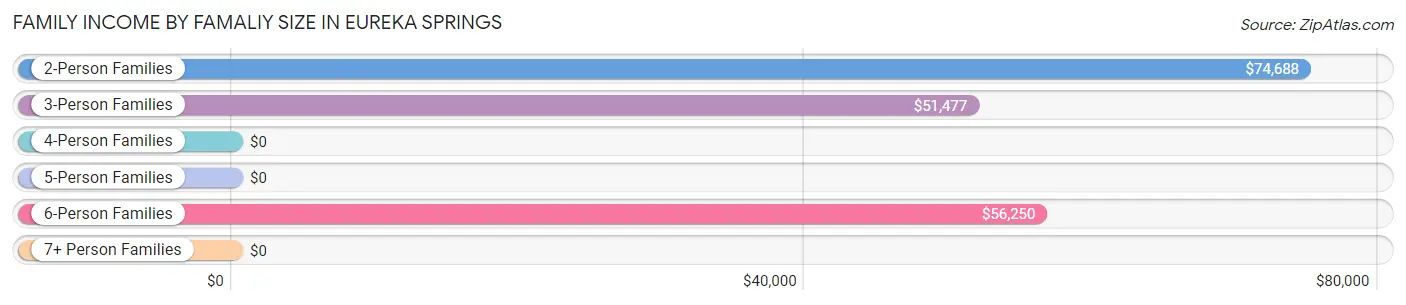
| Income Bracket | # Families | Median Income |
| 2-Person Families | 363 (71.7%) | $74,688 |
| 3-Person Families | 89 (17.6%) | $51,477 |
| 4-Person Families | 10 (2.0%) | $0 |
| 5-Person Families | 10 (2.0%) | $0 |
| 6-Person Families | 20 (4.0%) | $56,250 |
| 7+ Person Families | 14 (2.8%) | $0 |
| Total | 506 (100.0%) | $66,500 |
Family Income by Number of Earners in Eureka Springs
The median family income in Eureka Springs is $66,500, with families comprising 3+ earners (30) having the highest median family income of $103,864, while families with 1 earner (168) have the lowest median family income of $48,250, accounting for 5.9% and 33.2% of families, respectively.
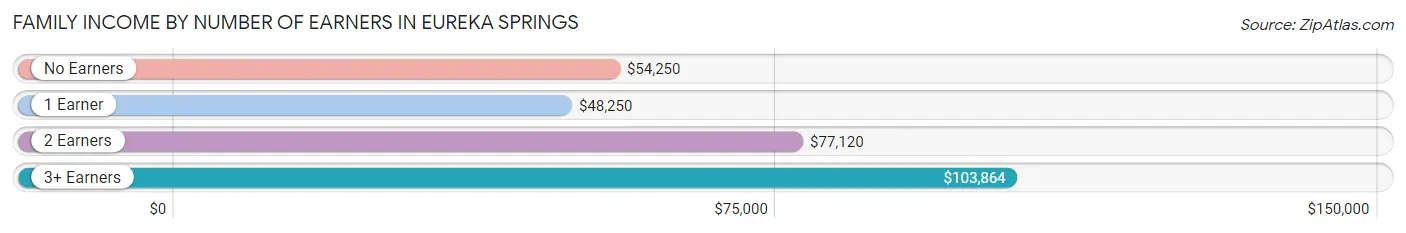
| Number of Earners | # Families | Median Income |
| No Earners | 111 (21.9%) | $54,250 |
| 1 Earner | 168 (33.2%) | $48,250 |
| 2 Earners | 197 (38.9%) | $77,120 |
| 3+ Earners | 30 (5.9%) | $103,864 |
| Total | 506 (100.0%) | $66,500 |
Household Income in Eureka Springs
Household Income Brackets in Eureka Springs
With 151 households falling in the category, the $15,000 to $24,999 income range is the most frequent in Eureka Springs, accounting for 16.2% of all households. In contrast, only 38 households (4.1%) fall into the $200,000+ income bracket, making it the least populous group.
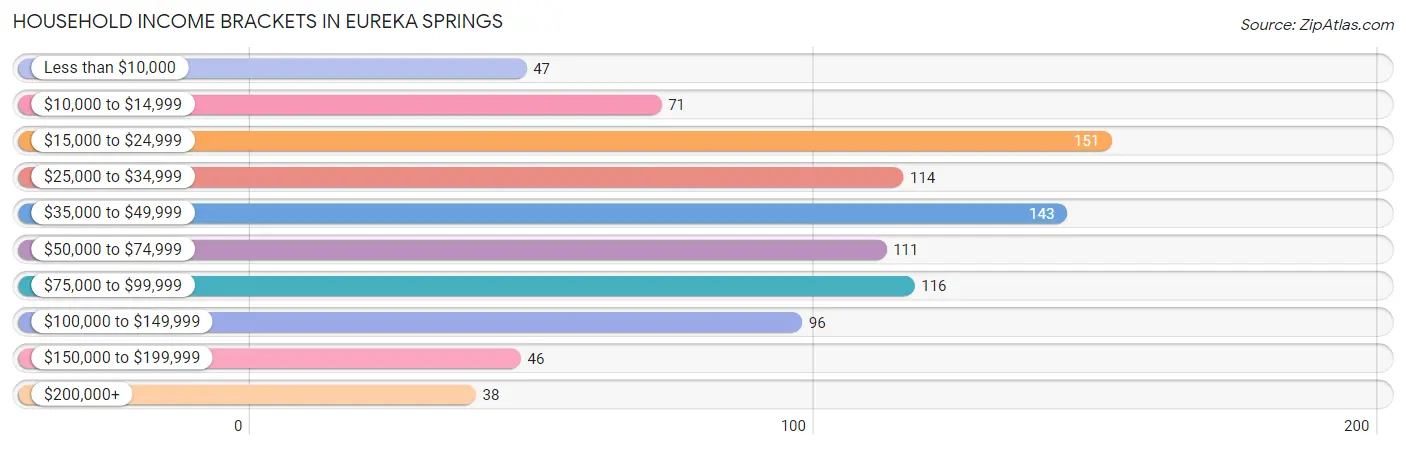
| Income Bracket | # Households | % Households |
| Less than $10,000 | 47 | 5.0% |
| $10,000 to $14,999 | 71 | 7.6% |
| $15,000 to $24,999 | 151 | 16.2% |
| $25,000 to $34,999 | 114 | 12.2% |
| $35,000 to $49,999 | 143 | 15.3% |
| $50,000 to $74,999 | 111 | 11.9% |
| $75,000 to $99,999 | 116 | 12.4% |
| $100,000 to $149,999 | 96 | 10.3% |
| $150,000 to $199,999 | 46 | 4.9% |
| $200,000+ | 38 | 4.1% |
Household Income by Householder Age in Eureka Springs
The median household income in Eureka Springs is $40,972, with the highest median household income of $58,750 found in the 45 to 64 years age bracket for the primary householder. A total of 452 households (48.4%) fall into this category. Meanwhile, the 15 to 24 years age bracket for the primary householder has the lowest median household income of $0, with 4 households (0.4%) in this group.
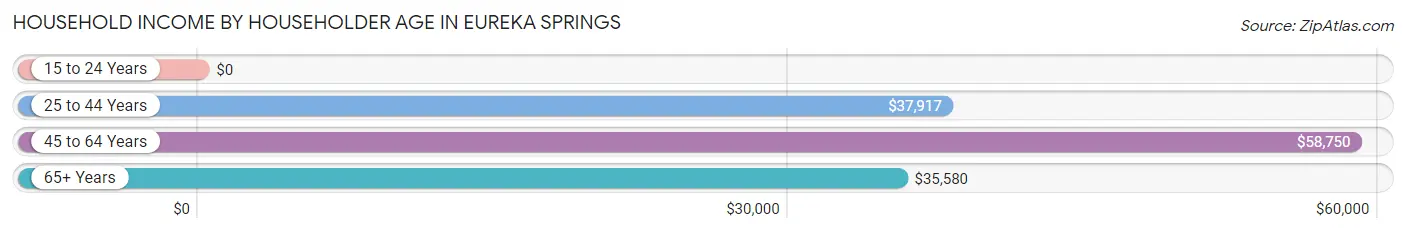
| Income Bracket | # Households | Median Income |
| 15 to 24 Years | 4 (0.4%) | $0 |
| 25 to 44 Years | 138 (14.8%) | $37,917 |
| 45 to 64 Years | 452 (48.4%) | $58,750 |
| 65+ Years | 339 (36.3%) | $35,580 |
| Total | 933 (100.0%) | $40,972 |
Poverty in Eureka Springs
Income Below Poverty by Sex and Age in Eureka Springs
With 4.7% poverty level for males and 15.4% for females among the residents of Eureka Springs, 16 and 17 year old males and 12 to 14 year old females are the most vulnerable to poverty, with 8 males (13.6%) and 9 females (40.9%) in their respective age groups living below the poverty level.
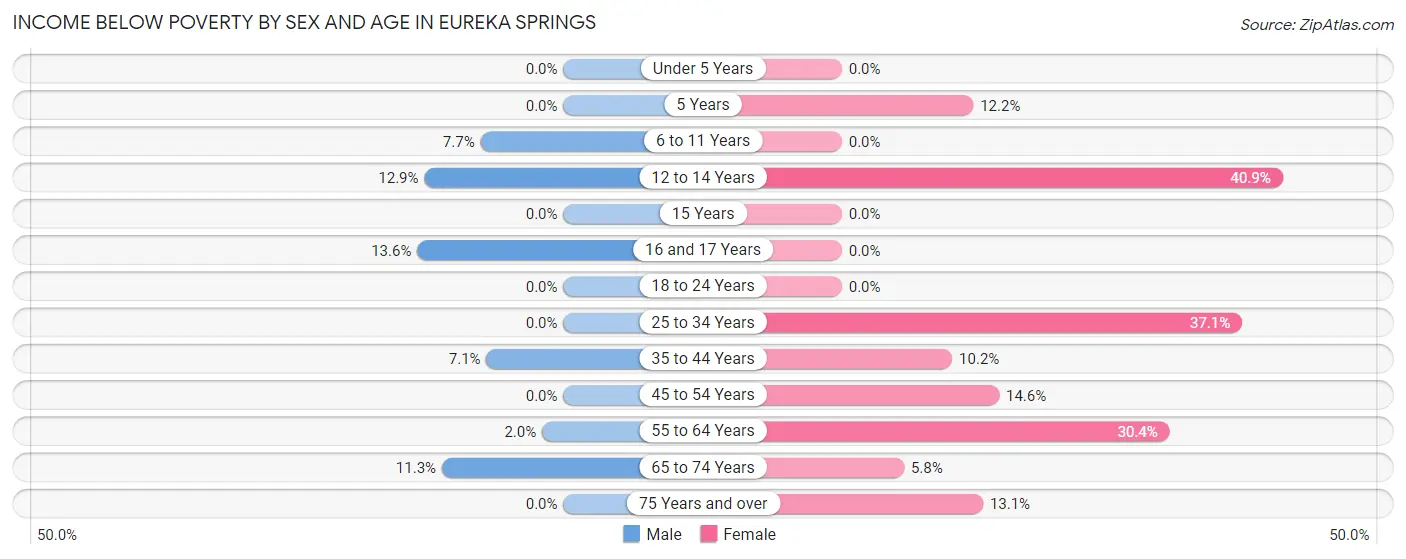
| Age Bracket | Male | Female |
| Under 5 Years | 0 (0.0%) | 0 (0.0%) |
| 5 Years | 0 (0.0%) | 5 (12.2%) |
| 6 to 11 Years | 3 (7.7%) | 0 (0.0%) |
| 12 to 14 Years | 4 (12.9%) | 9 (40.9%) |
| 15 Years | 0 (0.0%) | 0 (0.0%) |
| 16 and 17 Years | 8 (13.6%) | 0 (0.0%) |
| 18 to 24 Years | 0 (0.0%) | 0 (0.0%) |
| 25 to 34 Years | 0 (0.0%) | 26 (37.1%) |
| 35 to 44 Years | 5 (7.1%) | 13 (10.2%) |
| 45 to 54 Years | 0 (0.0%) | 27 (14.6%) |
| 55 to 64 Years | 4 (2.0%) | 49 (30.4%) |
| 65 to 74 Years | 23 (11.3%) | 9 (5.8%) |
| 75 Years and over | 0 (0.0%) | 11 (13.1%) |
| Total | 47 (4.7%) | 149 (15.4%) |
Income Above Poverty by Sex and Age in Eureka Springs
According to the poverty statistics in Eureka Springs, males aged under 5 years and females aged under 5 years are the age groups that are most secure financially, with 100.0% of males and 100.0% of females in these age groups living above the poverty line.
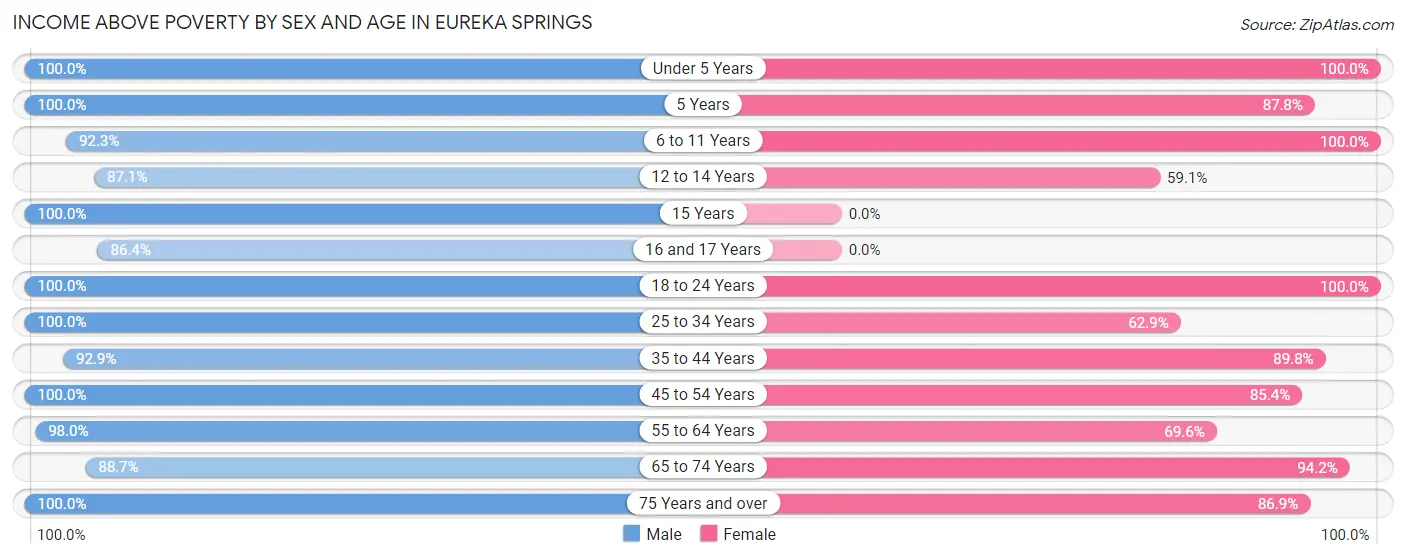
| Age Bracket | Male | Female |
| Under 5 Years | 32 (100.0%) | 37 (100.0%) |
| 5 Years | 5 (100.0%) | 36 (87.8%) |
| 6 to 11 Years | 36 (92.3%) | 65 (100.0%) |
| 12 to 14 Years | 27 (87.1%) | 13 (59.1%) |
| 15 Years | 10 (100.0%) | 0 (0.0%) |
| 16 and 17 Years | 51 (86.4%) | 0 (0.0%) |
| 18 to 24 Years | 78 (100.0%) | 22 (100.0%) |
| 25 to 34 Years | 52 (100.0%) | 44 (62.9%) |
| 35 to 44 Years | 65 (92.9%) | 114 (89.8%) |
| 45 to 54 Years | 170 (100.0%) | 158 (85.4%) |
| 55 to 64 Years | 198 (98.0%) | 112 (69.6%) |
| 65 to 74 Years | 181 (88.7%) | 147 (94.2%) |
| 75 Years and over | 52 (100.0%) | 73 (86.9%) |
| Total | 957 (95.3%) | 821 (84.6%) |
Income Below Poverty Among Married-Couple Families in Eureka Springs
The poverty statistics for married-couple families in Eureka Springs show that 2.6% or 10 of the total 388 families live below the poverty line. Families with 1 or 2 children have the highest poverty rate of 17.9%, comprising of 5 families. On the other hand, families with 3 or 4 children have the lowest poverty rate of 0.0%, which includes 0 families.
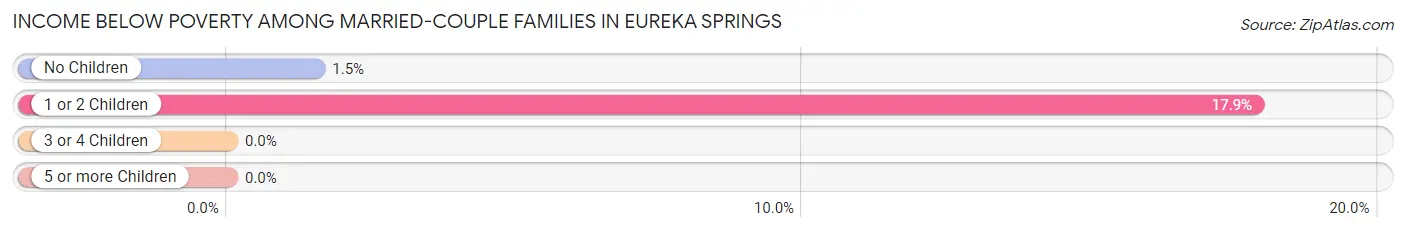
| Children | Above Poverty | Below Poverty |
| No Children | 324 (98.5%) | 5 (1.5%) |
| 1 or 2 Children | 23 (82.1%) | 5 (17.9%) |
| 3 or 4 Children | 17 (100.0%) | 0 (0.0%) |
| 5 or more Children | 14 (100.0%) | 0 (0.0%) |
| Total | 378 (97.4%) | 10 (2.6%) |
Income Below Poverty Among Single-Parent Households in Eureka Springs
According to the poverty data in Eureka Springs, 7.0% or 3 single-father households and 20.0% or 15 single-mother households are living below the poverty line. Among single-father households, those with 1 or 2 children have the highest poverty rate, with 3 households (10.0%) experiencing poverty. Likewise, among single-mother households, those with 1 or 2 children have the highest poverty rate, with 15 households (71.4%) falling below the poverty line.
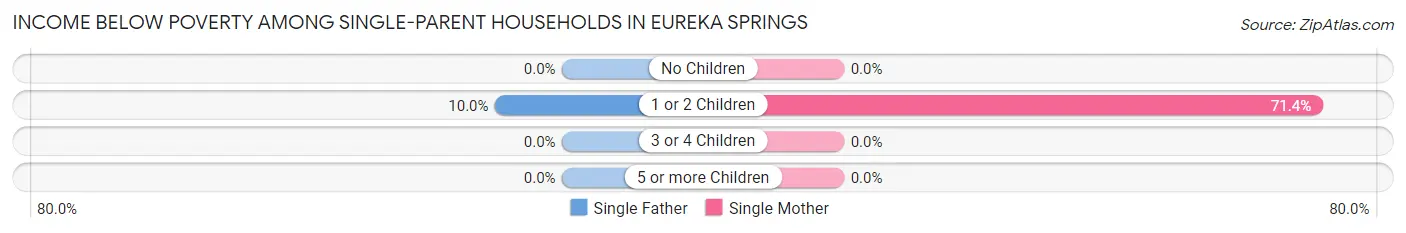
| Children | Single Father | Single Mother |
| No Children | 0 (0.0%) | 0 (0.0%) |
| 1 or 2 Children | 3 (10.0%) | 15 (71.4%) |
| 3 or 4 Children | 0 (0.0%) | 0 (0.0%) |
| 5 or more Children | 0 (0.0%) | 0 (0.0%) |
| Total | 3 (7.0%) | 15 (20.0%) |
Income Below Poverty Among Married-Couple vs Single-Parent Households in Eureka Springs
The poverty data for Eureka Springs shows that 10 of the married-couple family households (2.6%) and 18 of the single-parent households (15.2%) are living below the poverty level. Within the married-couple family households, those with 1 or 2 children have the highest poverty rate, with 5 households (17.9%) falling below the poverty line. Among the single-parent households, those with 1 or 2 children have the highest poverty rate, with 18 household (35.3%) living below poverty.
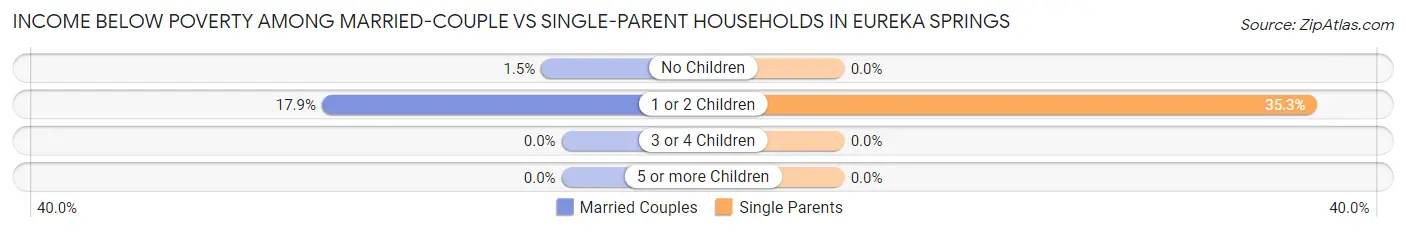
| Children | Married-Couple Families | Single-Parent Households |
| No Children | 5 (1.5%) | 0 (0.0%) |
| 1 or 2 Children | 5 (17.9%) | 18 (35.3%) |
| 3 or 4 Children | 0 (0.0%) | 0 (0.0%) |
| 5 or more Children | 0 (0.0%) | 0 (0.0%) |
| Total | 10 (2.6%) | 18 (15.2%) |
Race in Eureka Springs
The most populous races in Eureka Springs are White / Caucasian (1,790 | 87.2%), Two or more Races (184 | 9.0%), and Hispanic or Latino (83 | 4.0%).
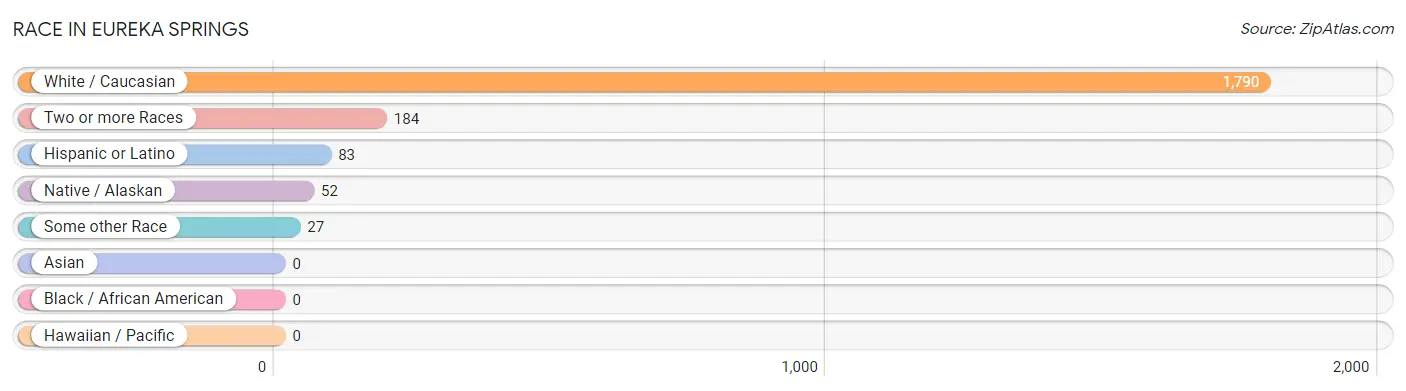
| Race | # Population | % Population |
| Asian | 0 | 0.0% |
| Black / African American | 0 | 0.0% |
| Hawaiian / Pacific | 0 | 0.0% |
| Hispanic or Latino | 83 | 4.0% |
| Native / Alaskan | 52 | 2.5% |
| White / Caucasian | 1,790 | 87.2% |
| Two or more Races | 184 | 9.0% |
| Some other Race | 27 | 1.3% |
| Total | 2,053 | 100.0% |
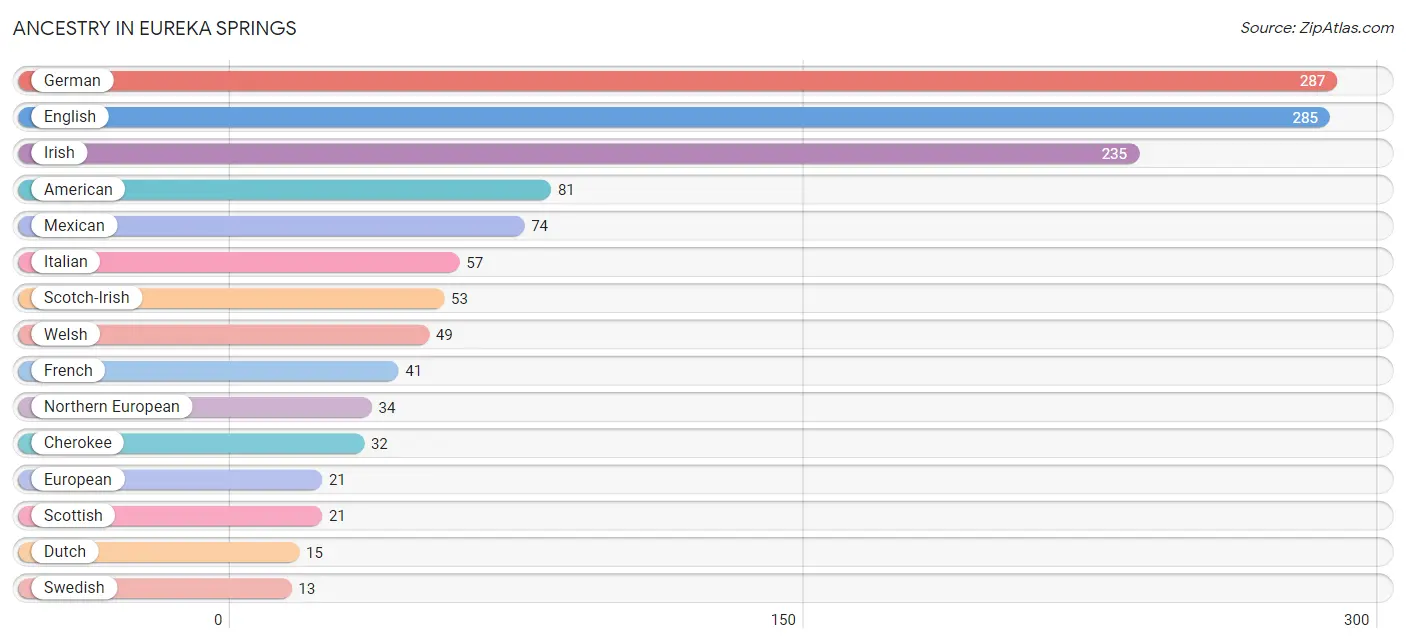
Ancestry in Eureka Springs
The most populous ancestries reported in Eureka Springs are German (287 | 14.0%), English (285 | 13.9%), Irish (235 | 11.5%), American (81 | 4.0%), and Mexican (74 | 3.6%), together accounting for 46.9% of all Eureka Springs residents.
| Ancestry | # Population | % Population |
| Afghan | 4 | 0.2% |
| American | 81 | 4.0% |
| Armenian | 4 | 0.2% |
| Bhutanese | 1 | 0.1% |
| British | 7 | 0.3% |
| Cherokee | 32 | 1.6% |
| Colombian | 9 | 0.4% |
| Croatian | 6 | 0.3% |
| Czech | 4 | 0.2% |
| Czechoslovakian | 7 | 0.3% |
| Delaware | 3 | 0.2% |
| Dutch | 15 | 0.7% |
| Eastern European | 4 | 0.2% |
| English | 285 | 13.9% |
| European | 21 | 1.0% |
| French | 41 | 2.0% |
| French Canadian | 10 | 0.5% |
| German | 287 | 14.0% |
| Houma | 1 | 0.1% |
| Hungarian | 5 | 0.2% |
| Irish | 235 | 11.5% |
| Italian | 57 | 2.8% |
| Mexican | 74 | 3.6% |
| Northern European | 34 | 1.7% |
| Norwegian | 10 | 0.5% |
| Polish | 3 | 0.2% |
| Potawatomi | 3 | 0.2% |
| Scotch-Irish | 53 | 2.6% |
| Scottish | 21 | 1.0% |
| Sioux | 3 | 0.2% |
| South American | 9 | 0.4% |
| Swedish | 13 | 0.6% |
| Welsh | 49 | 2.4% | View All 33 Rows |
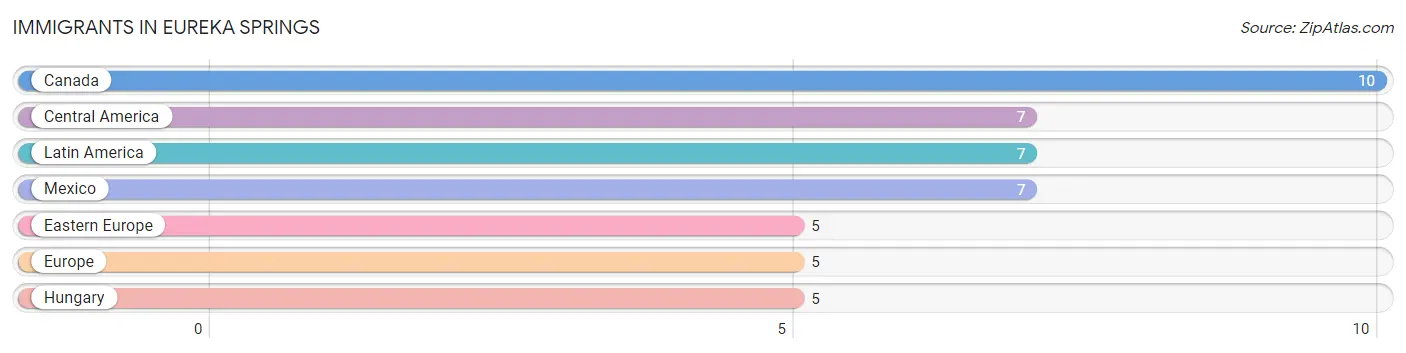
Immigrants in Eureka Springs
The most numerous immigrant groups reported in Eureka Springs came from Canada (10 | 0.5%), Central America (7 | 0.3%), Latin America (7 | 0.3%), Mexico (7 | 0.3%), and Eastern Europe (5 | 0.2%), together accounting for 1.8% of all Eureka Springs residents.
| Immigration Origin | # Population | % Population |
| Canada | 10 | 0.5% |
| Central America | 7 | 0.3% |
| Eastern Europe | 5 | 0.2% |
| Europe | 5 | 0.2% |
| Hungary | 5 | 0.2% |
| Latin America | 7 | 0.3% |
| Mexico | 7 | 0.3% | View All 7 Rows |
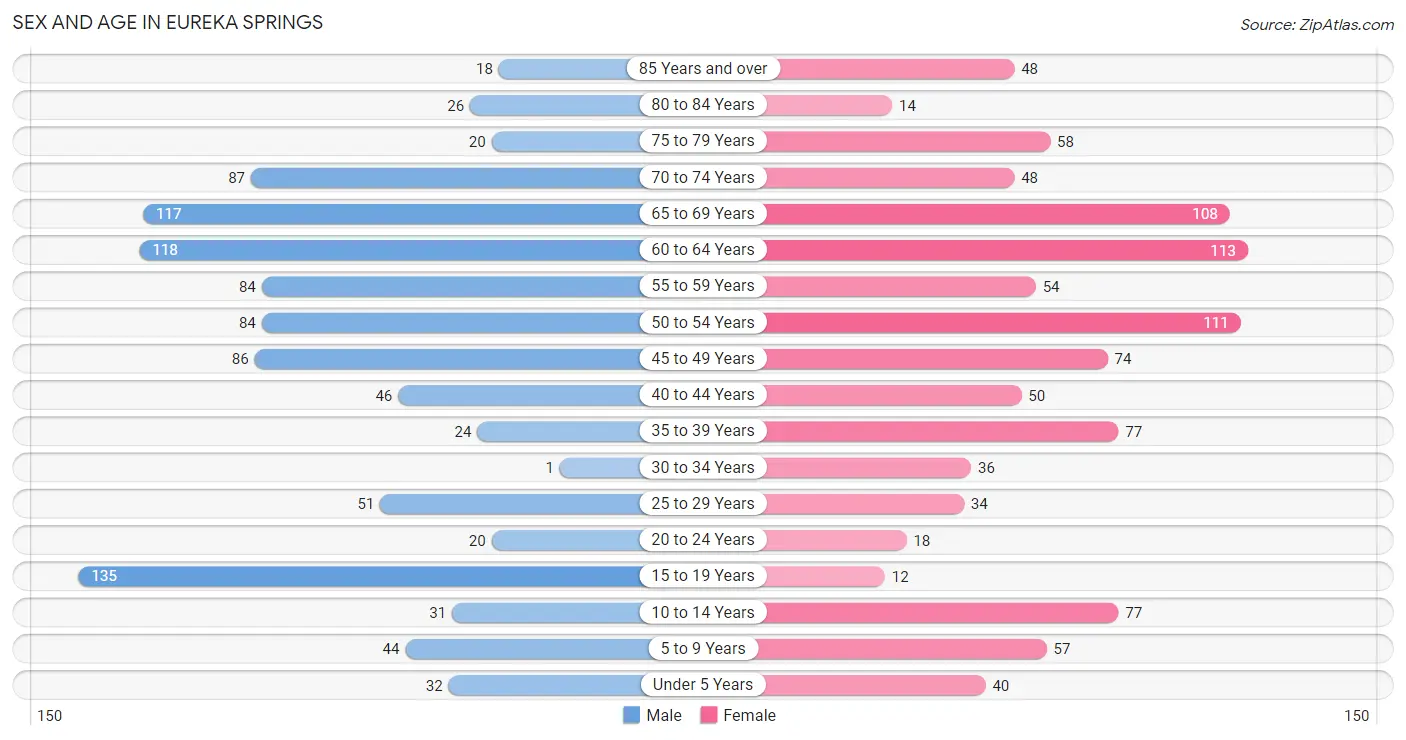
Sex and Age in Eureka Springs
Sex and Age in Eureka Springs
The most populous age groups in Eureka Springs are 15 to 19 Years (135 | 13.2%) for men and 60 to 64 Years (113 | 11.0%) for women.
| Age Bracket | Male | Female |
| Under 5 Years | 32 (3.1%) | 40 (3.9%) |
| 5 to 9 Years | 44 (4.3%) | 57 (5.5%) |
| 10 to 14 Years | 31 (3.0%) | 77 (7.5%) |
| 15 to 19 Years | 135 (13.2%) | 12 (1.2%) |
| 20 to 24 Years | 20 (1.9%) | 18 (1.8%) |
| 25 to 29 Years | 51 (5.0%) | 34 (3.3%) |
| 30 to 34 Years | 1 (0.1%) | 36 (3.5%) |
| 35 to 39 Years | 24 (2.3%) | 77 (7.5%) |
| 40 to 44 Years | 46 (4.5%) | 50 (4.9%) |
| 45 to 49 Years | 86 (8.4%) | 74 (7.2%) |
| 50 to 54 Years | 84 (8.2%) | 111 (10.8%) |
| 55 to 59 Years | 84 (8.2%) | 54 (5.2%) |
| 60 to 64 Years | 118 (11.5%) | 113 (11.0%) |
| 65 to 69 Years | 117 (11.4%) | 108 (10.5%) |
| 70 to 74 Years | 87 (8.5%) | 48 (4.7%) |
| 75 to 79 Years | 20 (1.9%) | 58 (5.6%) |
| 80 to 84 Years | 26 (2.5%) | 14 (1.4%) |
| 85 Years and over | 18 (1.8%) | 48 (4.7%) |
| Total | 1,024 (100.0%) | 1,029 (100.0%) |
Families and Households in Eureka Springs
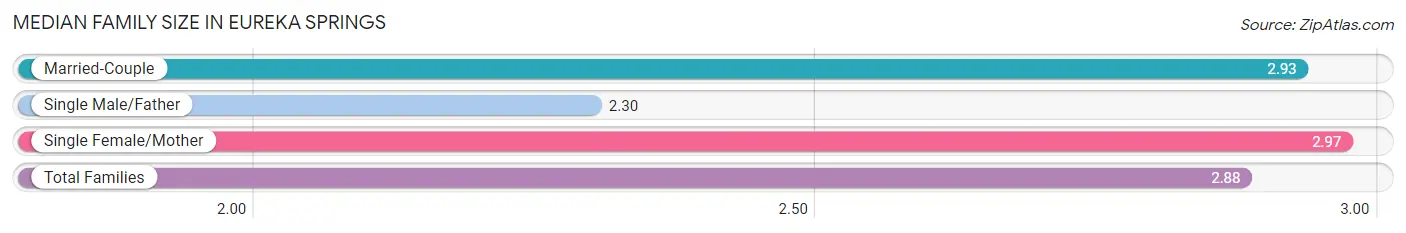
Median Family Size in Eureka Springs
The median family size in Eureka Springs is 2.88 persons per family, with single female/mother families (75 | 14.8%) accounting for the largest median family size of 2.97 persons per family. On the other hand, single male/father families (43 | 8.5%) represent the smallest median family size with 2.30 persons per family.
| Family Type | # Families | Family Size |
| Married-Couple | 388 (76.7%) | 2.93 |
| Single Male/Father | 43 (8.5%) | 2.30 |
| Single Female/Mother | 75 (14.8%) | 2.97 |
| Total Families | 506 (100.0%) | 2.88 |
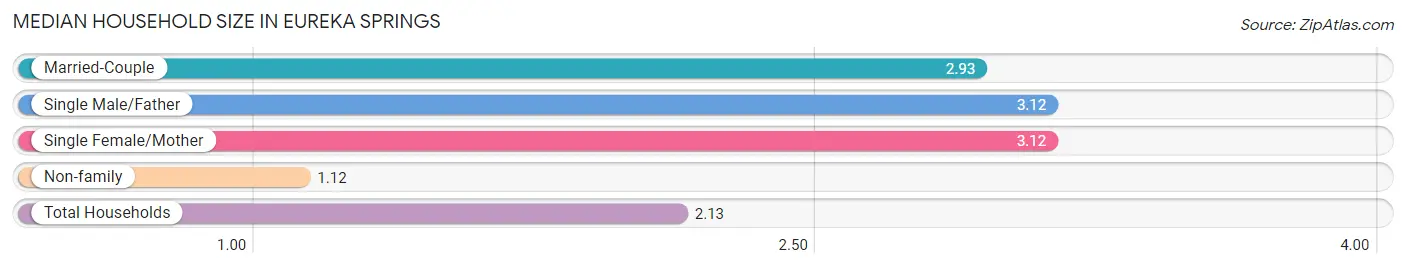
Median Household Size in Eureka Springs
The median household size in Eureka Springs is 2.13 persons per household, with single male/father households (43 | 4.6%) accounting for the largest median household size of 3.12 persons per household. non-family households (427 | 45.8%) represent the smallest median household size with 1.12 persons per household.
| Household Type | # Households | Household Size |
| Married-Couple | 388 (41.6%) | 2.93 |
| Single Male/Father | 43 (4.6%) | 3.12 |
| Single Female/Mother | 75 (8.0%) | 3.12 |
| Non-family | 427 (45.8%) | 1.12 |
| Total Households | 933 (100.0%) | 2.13 |
Household Size by Marriage Status in Eureka Springs
Out of a total of 933 households in Eureka Springs, 506 (54.2%) are family households, while 427 (45.8%) are nonfamily households. The most numerous type of family households are 2-person households, comprising 330, and the most common type of nonfamily households are 1-person households, comprising 383.
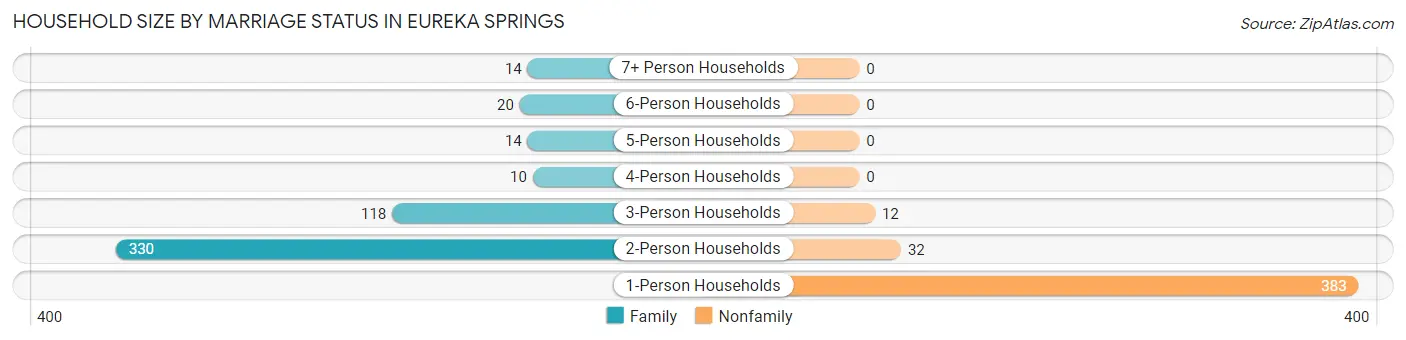
| Household Size | Family Households | Nonfamily Households |
| 1-Person Households | - | 383 (41.0%) |
| 2-Person Households | 330 (35.4%) | 32 (3.4%) |
| 3-Person Households | 118 (12.7%) | 12 (1.3%) |
| 4-Person Households | 10 (1.1%) | 0 (0.0%) |
| 5-Person Households | 14 (1.5%) | 0 (0.0%) |
| 6-Person Households | 20 (2.1%) | 0 (0.0%) |
| 7+ Person Households | 14 (1.5%) | 0 (0.0%) |
| Total | 506 (54.2%) | 427 (45.8%) |
Female Fertility in Eureka Springs
Fertility by Age in Eureka Springs
Average fertility rate in Eureka Springs is 105.0 births per 1,000 women. Women in the age bracket of 20 to 34 years have the highest fertility rate with 341.0 births per 1,000 women. Women in the age bracket of 20 to 34 years acount for 88.2% of all women with births.
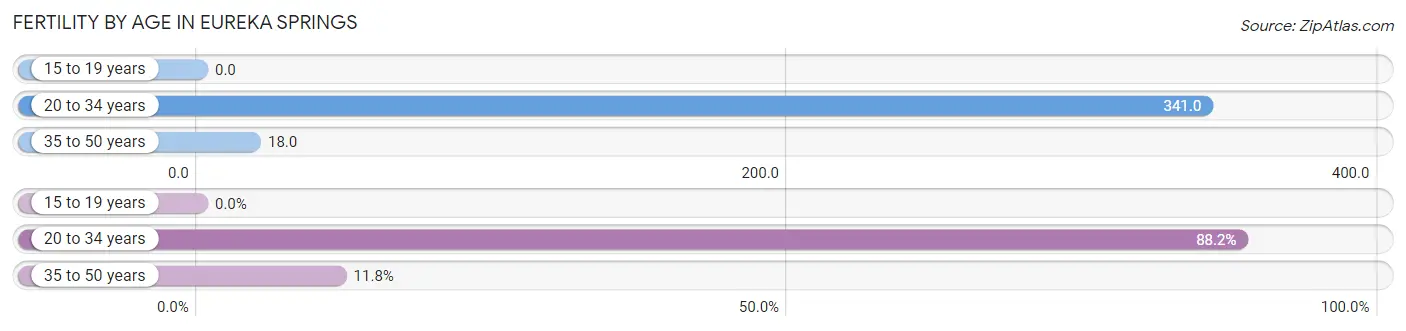
| Age Bracket | Women with Births | Births / 1,000 Women |
| 15 to 19 years | 0 (0.0%) | 0.0 |
| 20 to 34 years | 30 (88.2%) | 341.0 |
| 35 to 50 years | 4 (11.8%) | 18.0 |
| Total | 34 (100.0%) | 105.0 |
Fertility by Age by Marriage Status in Eureka Springs
23.5% of women with births (34) in Eureka Springs are married. The highest percentage of unmarried women with births falls into 20 to 34 years age bracket with 86.7% of them unmarried at the time of birth, while the lowest percentage of unmarried women with births belong to 35 to 50 years age bracket with 0.0% of them unmarried.
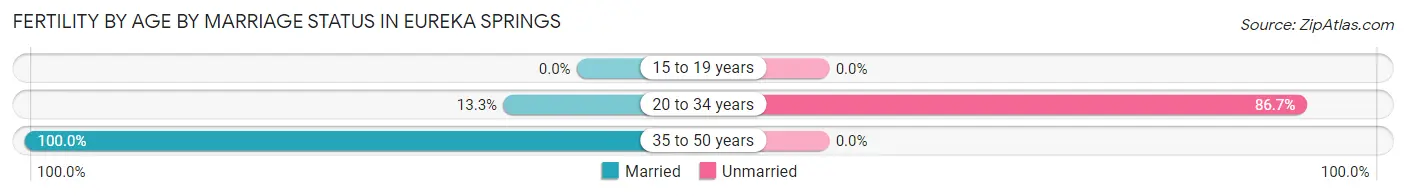
| Age Bracket | Married | Unmarried |
| 15 to 19 years | 0 (0.0%) | 0 (0.0%) |
| 20 to 34 years | 4 (13.3%) | 26 (86.7%) |
| 35 to 50 years | 4 (100.0%) | 0 (0.0%) |
| Total | 8 (23.5%) | 26 (76.5%) |
Fertility by Education in Eureka Springs
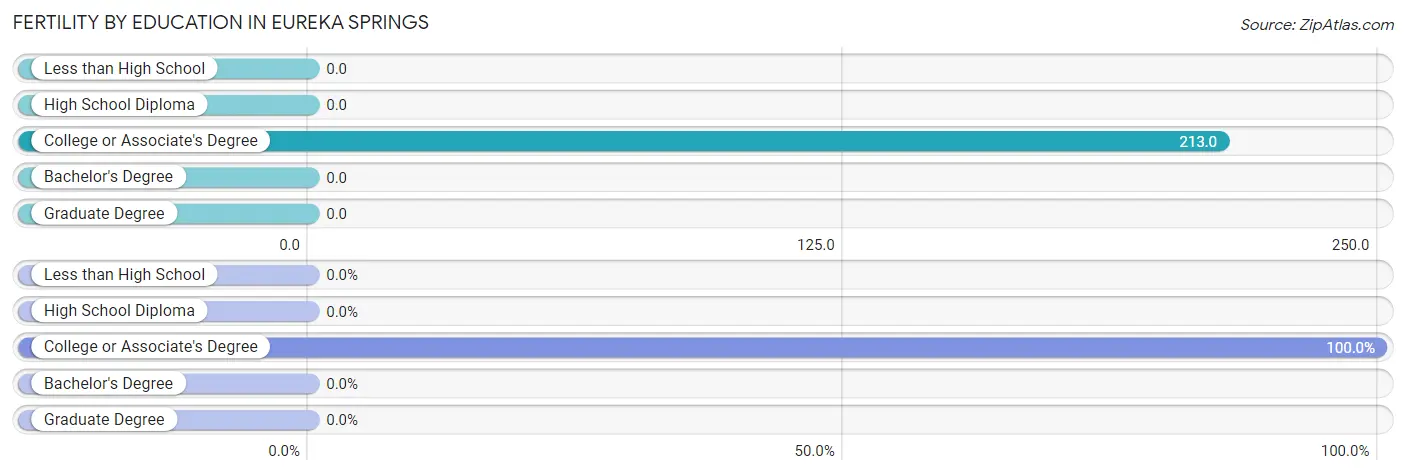
| Educational Attainment | Women with Births | Births / 1,000 Women |
| Less than High School | 0 (0.0%) | 0.0 |
| High School Diploma | 0 (0.0%) | 0.0 |
| College or Associate's Degree | 34 (100.0%) | 213.0 |
| Bachelor's Degree | 0 (0.0%) | 0.0 |
| Graduate Degree | 0 (0.0%) | 0.0 |
| Total | 34 (100.0%) | 105.0 |
Fertility by Education by Marriage Status in Eureka Springs
76.5% of women with births in Eureka Springs are unmarried. Women with the educational attainment of college or associate's degree are most likely to be married with 23.5% of them married at childbirth, while women with the educational attainment of college or associate's degree are least likely to be married with 76.5% of them unmarried at childbirth.
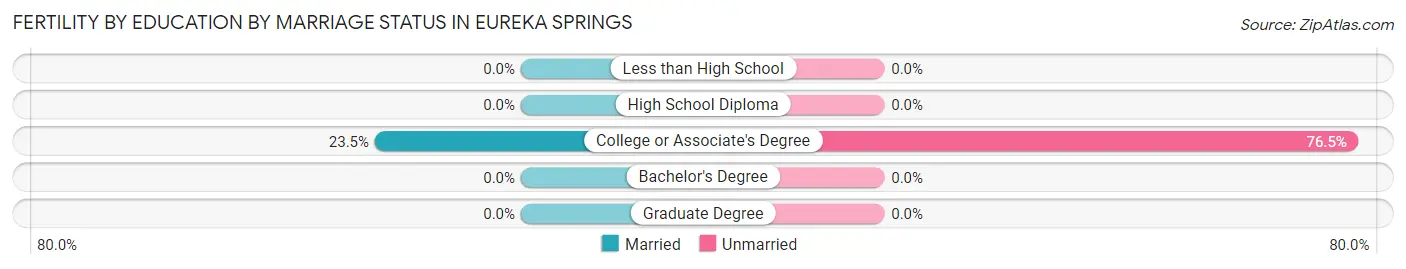
| Educational Attainment | Married | Unmarried |
| Less than High School | 0 (0.0%) | 0 (0.0%) |
| High School Diploma | 0 (0.0%) | 0 (0.0%) |
| College or Associate's Degree | 8 (23.5%) | 26 (76.5%) |
| Bachelor's Degree | 0 (0.0%) | 0 (0.0%) |
| Graduate Degree | 0 (0.0%) | 0 (0.0%) |
| Total | 8 (23.5%) | 26 (76.5%) |
Employment Characteristics in Eureka Springs
Employment by Class of Employer in Eureka Springs
Among the 806 employed individuals in Eureka Springs, private company employees (528 | 65.5%), not-for-profit organizations (124 | 15.4%), and self-employed (not incorporated) (74 | 9.2%) make up the most common classes of employment.
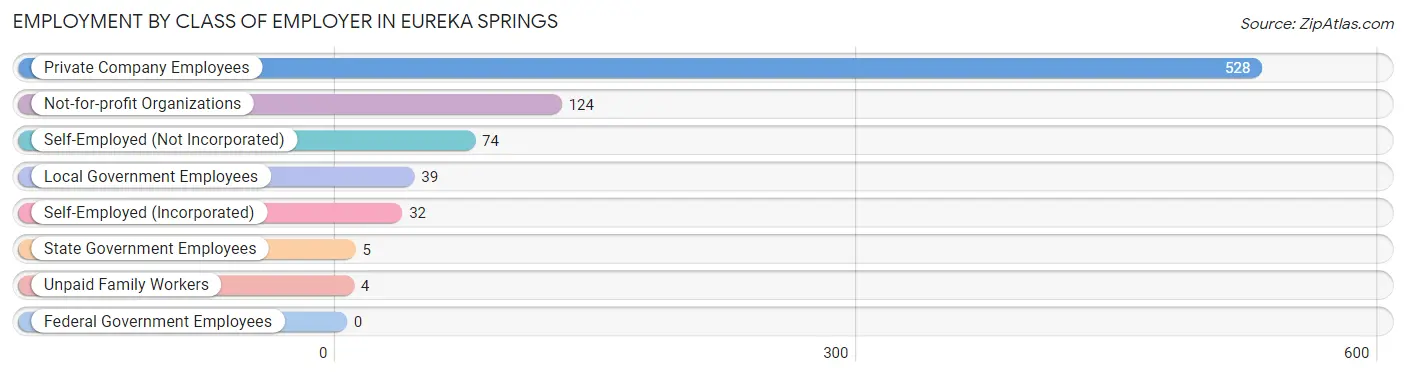
| Employer Class | # Employees | % Employees |
| Private Company Employees | 528 | 65.5% |
| Self-Employed (Incorporated) | 32 | 4.0% |
| Self-Employed (Not Incorporated) | 74 | 9.2% |
| Not-for-profit Organizations | 124 | 15.4% |
| Local Government Employees | 39 | 4.8% |
| State Government Employees | 5 | 0.6% |
| Federal Government Employees | 0 | 0.0% |
| Unpaid Family Workers | 4 | 0.5% |
| Total | 806 | 100.0% |
Employment Status by Age in Eureka Springs
According to the labor force statistics for Eureka Springs, out of the total population over 16 years of age (1,762), 46.6% or 821 individuals are in the labor force, with 1.1% or 9 of them unemployed. The age group with the highest labor force participation rate is 20 to 24 years, with 100.0% or 38 individuals in the labor force. Within the labor force, the 20 to 24 years age range has the highest percentage of unemployed individuals, with 13.2% or 5 of them being unemployed.
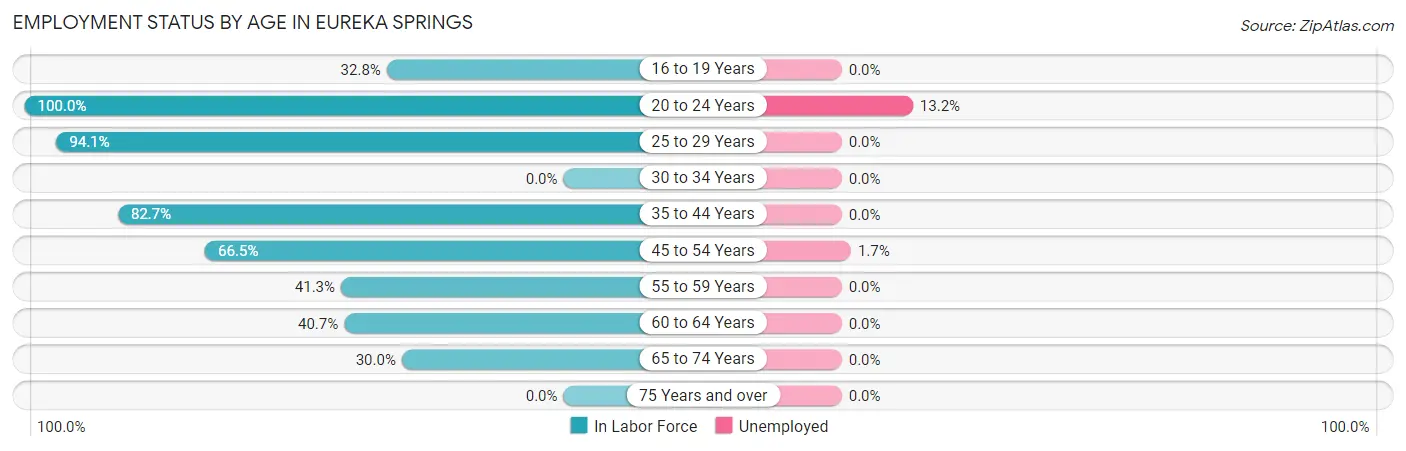
| Age Bracket | In Labor Force | Unemployed |
| 16 to 19 Years | 45 (32.8%) | 0 (0.0%) |
| 20 to 24 Years | 38 (100.0%) | 5 (13.2%) |
| 25 to 29 Years | 80 (94.1%) | 0 (0.0%) |
| 30 to 34 Years | 0 (0.0%) | 0 (0.0%) |
| 35 to 44 Years | 163 (82.7%) | 0 (0.0%) |
| 45 to 54 Years | 236 (66.5%) | 4 (1.7%) |
| 55 to 59 Years | 57 (41.3%) | 0 (0.0%) |
| 60 to 64 Years | 94 (40.7%) | 0 (0.0%) |
| 65 to 74 Years | 108 (30.0%) | 0 (0.0%) |
| 75 Years and over | 0 (0.0%) | 0 (0.0%) |
| Total | 821 (46.6%) | 9 (1.1%) |
Employment Status by Educational Attainment in Eureka Springs
According to labor force statistics for Eureka Springs, 60.4% of individuals (630) out of the total population between 25 and 64 years of age (1,043) are in the labor force, with 0.6% or 4 of them being unemployed. The group with the highest labor force participation rate are those with the educational attainment of less than high school, with 85.5% or 59 individuals in the labor force. Within the labor force, individuals with college / associate degree education have the highest percentage of unemployment, with 1.7% or 4 of them being unemployed.
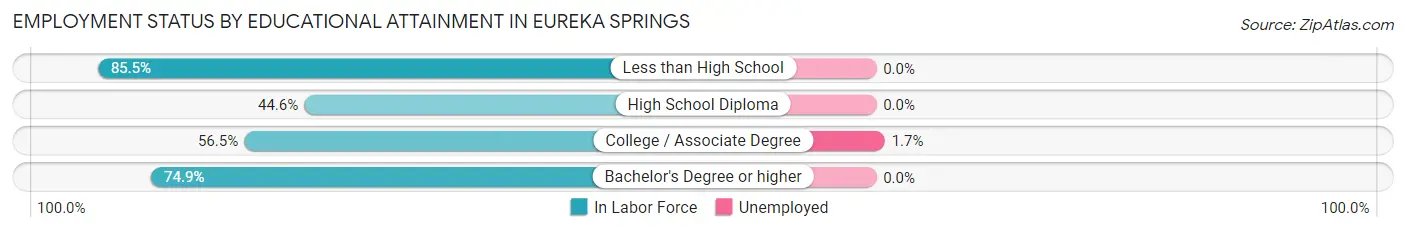
| Educational Attainment | In Labor Force | Unemployed |
| Less than High School | 59 (85.5%) | 0 (0.0%) |
| High School Diploma | 120 (44.6%) | 0 (0.0%) |
| College / Associate Degree | 236 (56.5%) | 7 (1.7%) |
| Bachelor's Degree or higher | 215 (74.9%) | 0 (0.0%) |
| Total | 630 (60.4%) | 6 (0.6%) |
Employment Occupations by Sex in Eureka Springs
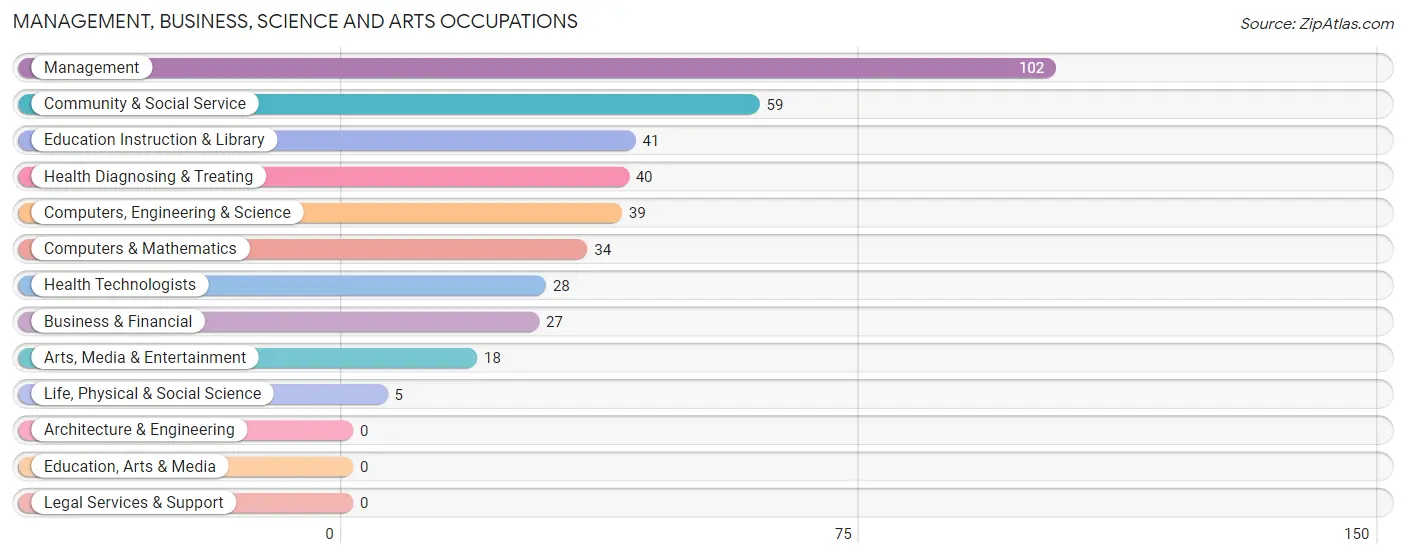
Management, Business, Science and Arts Occupations
The most common Management, Business, Science and Arts occupations in Eureka Springs are Management (102 | 12.6%), Community & Social Service (59 | 7.3%), Education Instruction & Library (41 | 5.1%), Health Diagnosing & Treating (40 | 4.9%), and Computers, Engineering & Science (39 | 4.8%).
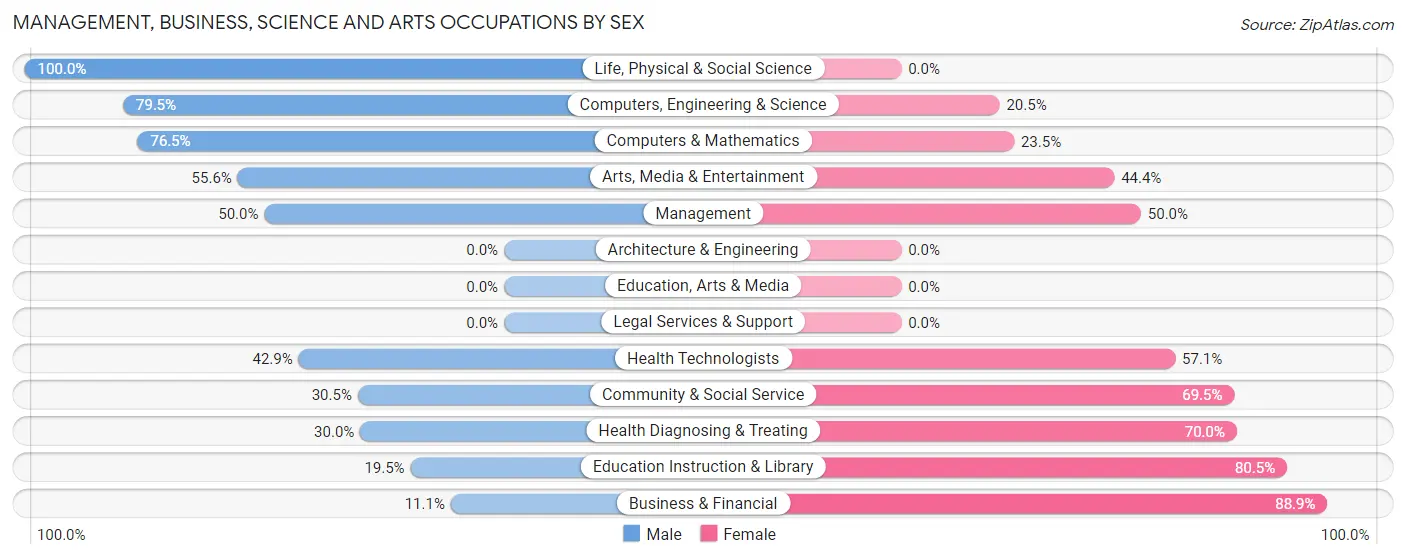
Management, Business, Science and Arts Occupations by Sex
Within the Management, Business, Science and Arts occupations in Eureka Springs, the most male-oriented occupations are Life, Physical & Social Science (100.0%), Computers, Engineering & Science (79.5%), and Computers & Mathematics (76.5%), while the most female-oriented occupations are Business & Financial (88.9%), Education Instruction & Library (80.5%), and Health Diagnosing & Treating (70.0%).
| Occupation | Male | Female |
| Management | 51 (50.0%) | 51 (50.0%) |
| Business & Financial | 3 (11.1%) | 24 (88.9%) |
| Computers, Engineering & Science | 31 (79.5%) | 8 (20.5%) |
| Computers & Mathematics | 26 (76.5%) | 8 (23.5%) |
| Architecture & Engineering | 0 (0.0%) | 0 (0.0%) |
| Life, Physical & Social Science | 5 (100.0%) | 0 (0.0%) |
| Community & Social Service | 18 (30.5%) | 41 (69.5%) |
| Education, Arts & Media | 0 (0.0%) | 0 (0.0%) |
| Legal Services & Support | 0 (0.0%) | 0 (0.0%) |
| Education Instruction & Library | 8 (19.5%) | 33 (80.5%) |
| Arts, Media & Entertainment | 10 (55.6%) | 8 (44.4%) |
| Health Diagnosing & Treating | 12 (30.0%) | 28 (70.0%) |
| Health Technologists | 12 (42.9%) | 16 (57.1%) |
| Total (Category) | 115 (43.1%) | 152 (56.9%) |
| Total (Overall) | 415 (51.1%) | 397 (48.9%) |
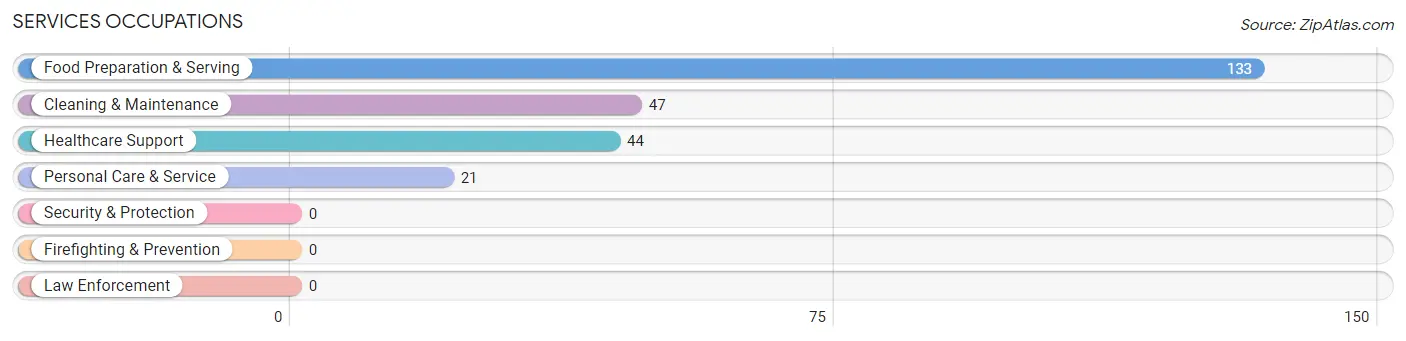
Services Occupations
The most common Services occupations in Eureka Springs are Food Preparation & Serving (133 | 16.4%), Cleaning & Maintenance (47 | 5.8%), Healthcare Support (44 | 5.4%), and Personal Care & Service (21 | 2.6%).
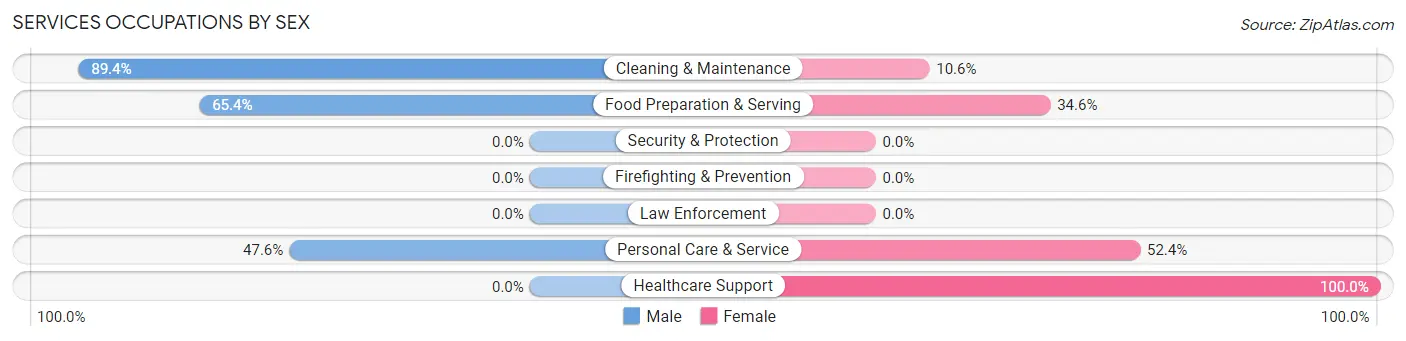
Services Occupations by Sex
Within the Services occupations in Eureka Springs, the most male-oriented occupations are Cleaning & Maintenance (89.4%), Food Preparation & Serving (65.4%), and Personal Care & Service (47.6%), while the most female-oriented occupations are Healthcare Support (100.0%), Personal Care & Service (52.4%), and Food Preparation & Serving (34.6%).
| Occupation | Male | Female |
| Healthcare Support | 0 (0.0%) | 44 (100.0%) |
| Security & Protection | 0 (0.0%) | 0 (0.0%) |
| Firefighting & Prevention | 0 (0.0%) | 0 (0.0%) |
| Law Enforcement | 0 (0.0%) | 0 (0.0%) |
| Food Preparation & Serving | 87 (65.4%) | 46 (34.6%) |
| Cleaning & Maintenance | 42 (89.4%) | 5 (10.6%) |
| Personal Care & Service | 10 (47.6%) | 11 (52.4%) |
| Total (Category) | 139 (56.7%) | 106 (43.3%) |
| Total (Overall) | 415 (51.1%) | 397 (48.9%) |
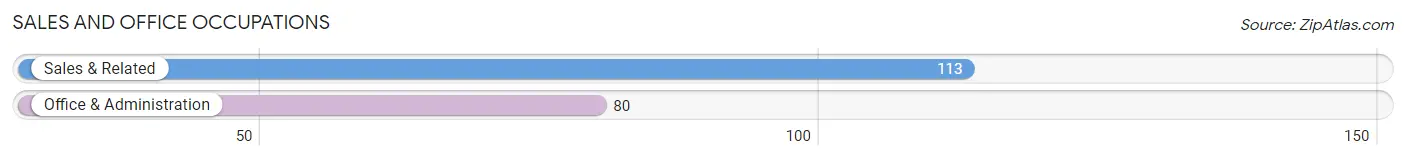
Sales and Office Occupations
The most common Sales and Office occupations in Eureka Springs are Sales & Related (113 | 13.9%), and Office & Administration (80 | 9.9%).
Sales and Office Occupations by Sex
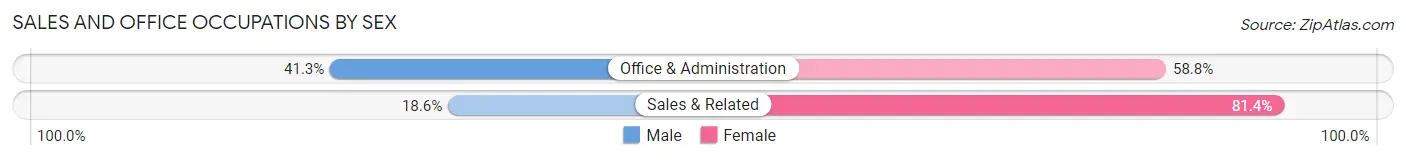
| Occupation | Male | Female |
| Sales & Related | 21 (18.6%) | 92 (81.4%) |
| Office & Administration | 33 (41.2%) | 47 (58.8%) |
| Total (Category) | 54 (28.0%) | 139 (72.0%) |
| Total (Overall) | 415 (51.1%) | 397 (48.9%) |
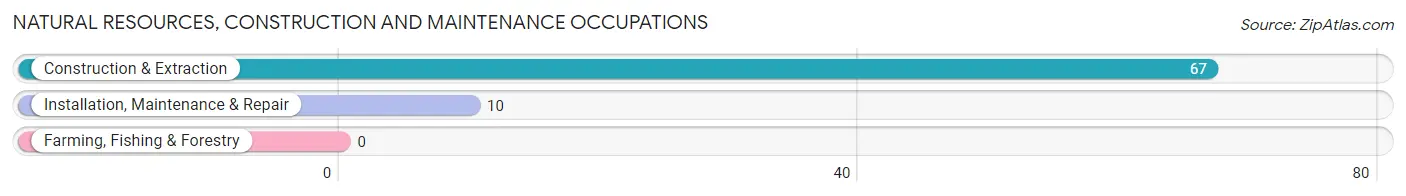
Natural Resources, Construction and Maintenance Occupations
The most common Natural Resources, Construction and Maintenance occupations in Eureka Springs are Construction & Extraction (67 | 8.3%), and Installation, Maintenance & Repair (10 | 1.2%).
Natural Resources, Construction and Maintenance Occupations by Sex
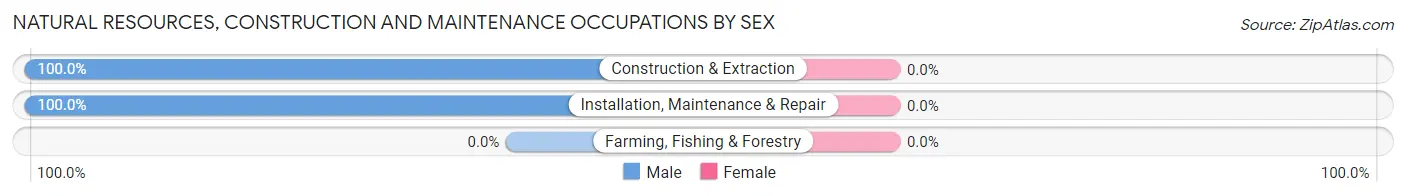
| Occupation | Male | Female |
| Farming, Fishing & Forestry | 0 (0.0%) | 0 (0.0%) |
| Construction & Extraction | 67 (100.0%) | 0 (0.0%) |
| Installation, Maintenance & Repair | 10 (100.0%) | 0 (0.0%) |
| Total (Category) | 77 (100.0%) | 0 (0.0%) |
| Total (Overall) | 415 (51.1%) | 397 (48.9%) |
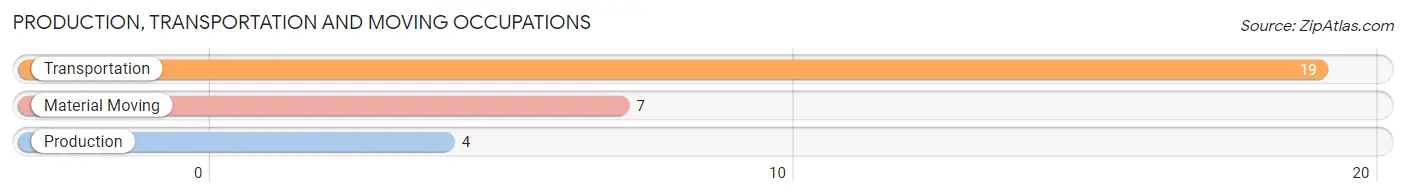
Production, Transportation and Moving Occupations
The most common Production, Transportation and Moving occupations in Eureka Springs are Transportation (19 | 2.3%), Material Moving (7 | 0.9%), and Production (4 | 0.5%).
Production, Transportation and Moving Occupations by Sex
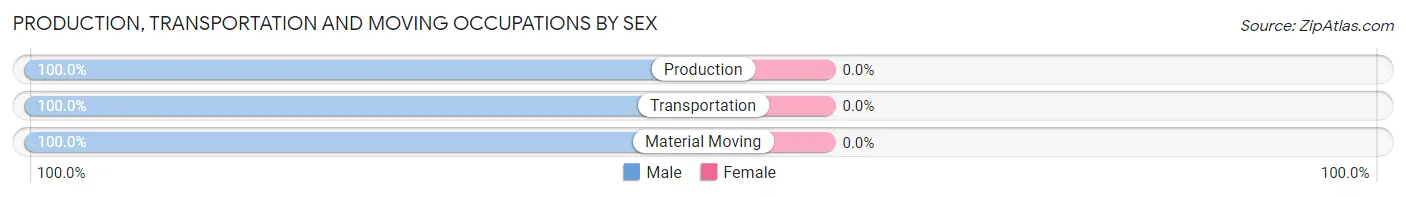
| Occupation | Male | Female |
| Production | 4 (100.0%) | 0 (0.0%) |
| Transportation | 19 (100.0%) | 0 (0.0%) |
| Material Moving | 7 (100.0%) | 0 (0.0%) |
| Total (Category) | 30 (100.0%) | 0 (0.0%) |
| Total (Overall) | 415 (51.1%) | 397 (48.9%) |
Employment Industries by Sex in Eureka Springs
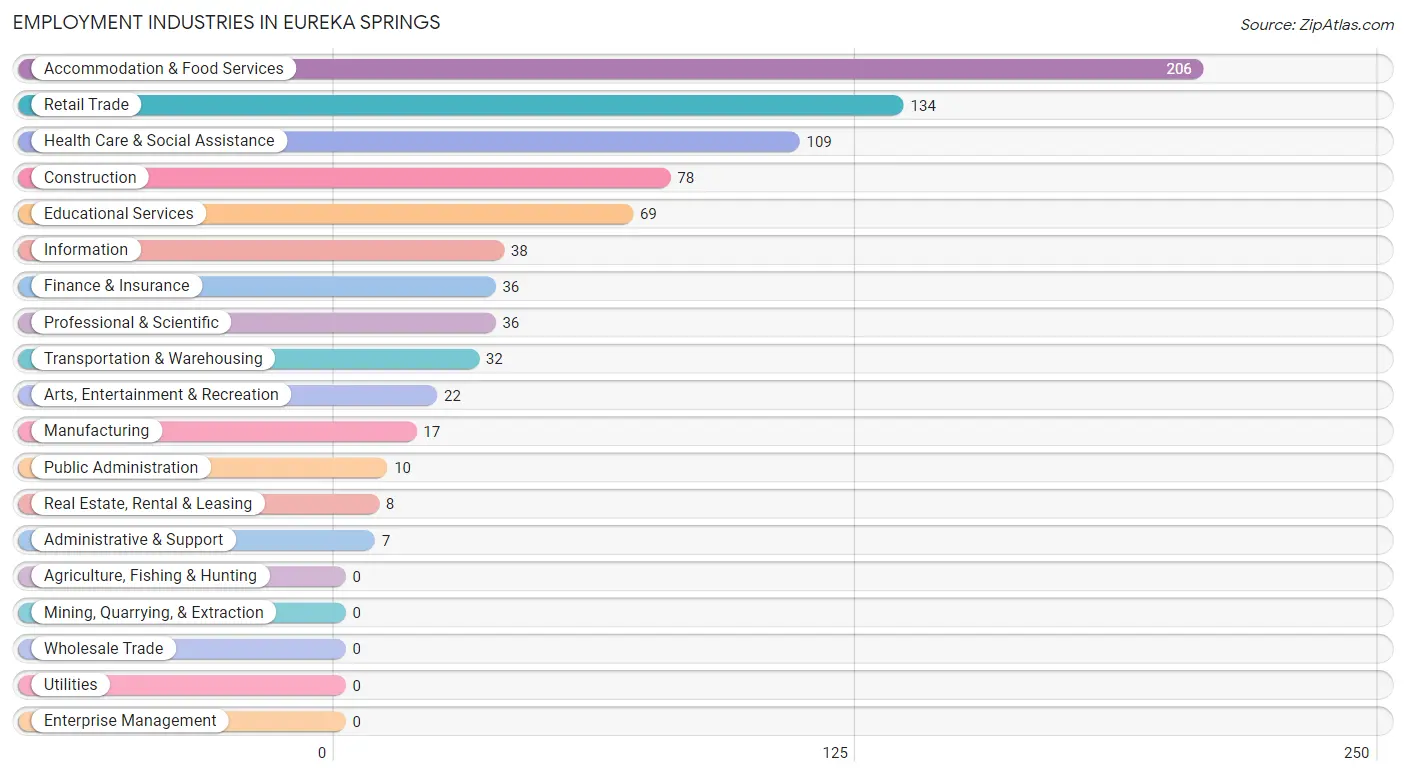
Employment Industries in Eureka Springs
The major employment industries in Eureka Springs include Accommodation & Food Services (206 | 25.4%), Retail Trade (134 | 16.5%), Health Care & Social Assistance (109 | 13.4%), Construction (78 | 9.6%), and Educational Services (69 | 8.5%).
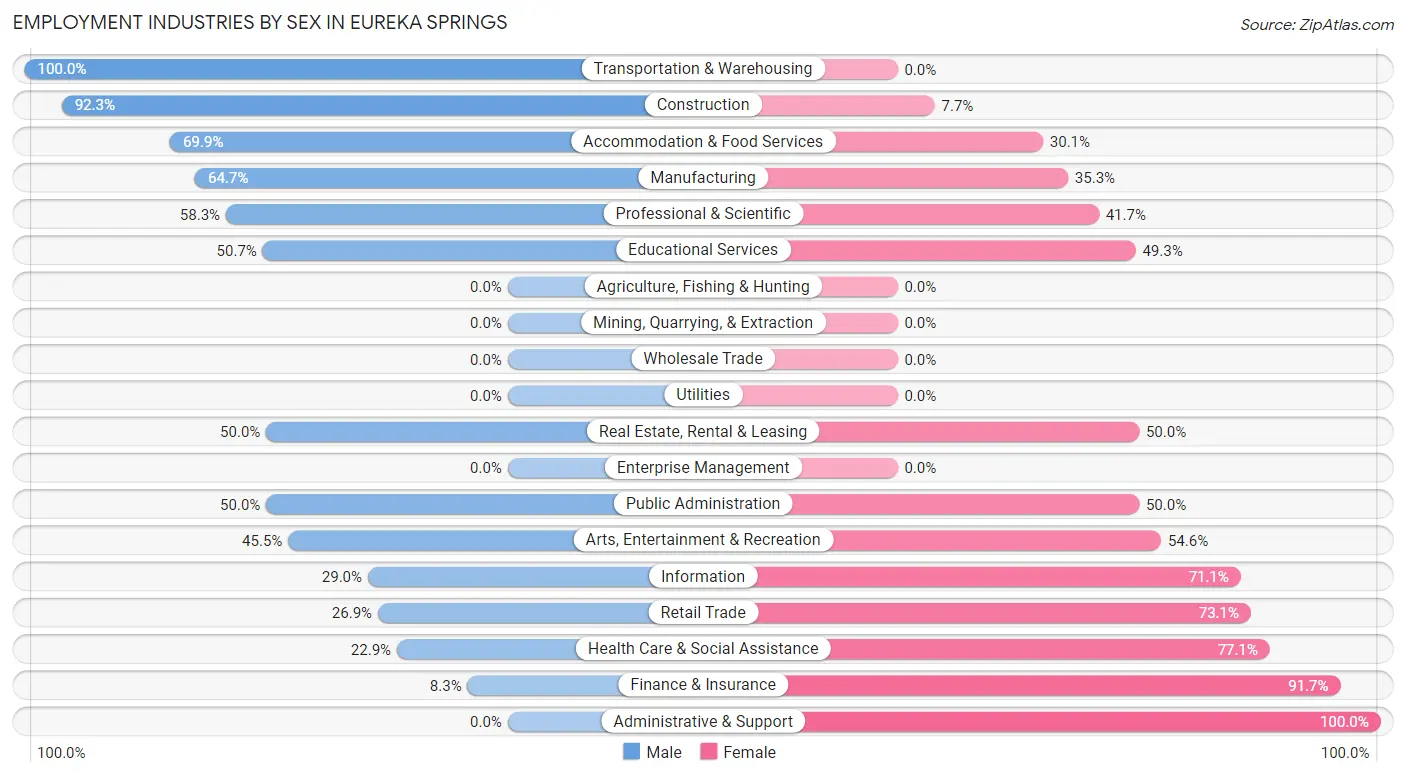
Employment Industries by Sex in Eureka Springs
The Eureka Springs industries that see more men than women are Transportation & Warehousing (100.0%), Construction (92.3%), and Accommodation & Food Services (69.9%), whereas the industries that tend to have a higher number of women are Administrative & Support (100.0%), Finance & Insurance (91.7%), and Health Care & Social Assistance (77.1%).
| Industry | Male | Female |
| Agriculture, Fishing & Hunting | 0 (0.0%) | 0 (0.0%) |
| Mining, Quarrying, & Extraction | 0 (0.0%) | 0 (0.0%) |
| Construction | 72 (92.3%) | 6 (7.7%) |
| Manufacturing | 11 (64.7%) | 6 (35.3%) |
| Wholesale Trade | 0 (0.0%) | 0 (0.0%) |
| Retail Trade | 36 (26.9%) | 98 (73.1%) |
| Transportation & Warehousing | 32 (100.0%) | 0 (0.0%) |
| Utilities | 0 (0.0%) | 0 (0.0%) |
| Information | 11 (28.9%) | 27 (71.1%) |
| Finance & Insurance | 3 (8.3%) | 33 (91.7%) |
| Real Estate, Rental & Leasing | 4 (50.0%) | 4 (50.0%) |
| Professional & Scientific | 21 (58.3%) | 15 (41.7%) |
| Enterprise Management | 0 (0.0%) | 0 (0.0%) |
| Administrative & Support | 0 (0.0%) | 7 (100.0%) |
| Educational Services | 35 (50.7%) | 34 (49.3%) |
| Health Care & Social Assistance | 25 (22.9%) | 84 (77.1%) |
| Arts, Entertainment & Recreation | 10 (45.5%) | 12 (54.5%) |
| Accommodation & Food Services | 144 (69.9%) | 62 (30.1%) |
| Public Administration | 5 (50.0%) | 5 (50.0%) |
| Total | 415 (51.1%) | 397 (48.9%) |
Education in Eureka Springs
School Enrollment in Eureka Springs
The most common levels of schooling among the 351 students in Eureka Springs are middle school (113 | 32.2%), high school (78 | 22.2%), and college / undergraduate (54 | 15.4%).
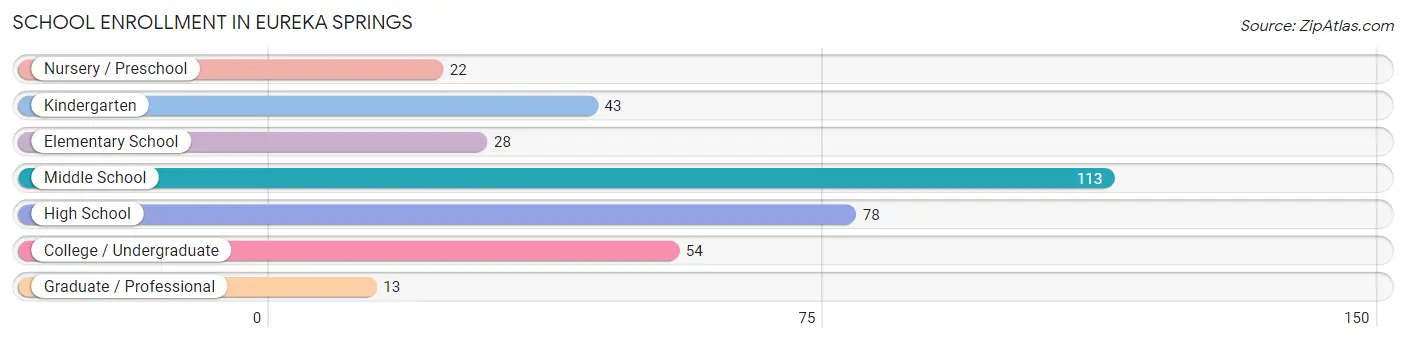
| School Level | # Students | % Students |
| Nursery / Preschool | 22 | 6.3% |
| Kindergarten | 43 | 12.2% |
| Elementary School | 28 | 8.0% |
| Middle School | 113 | 32.2% |
| High School | 78 | 22.2% |
| College / Undergraduate | 54 | 15.4% |
| Graduate / Professional | 13 | 3.7% |
| Total | 351 | 100.0% |
School Enrollment by Age by Funding Source in Eureka Springs
Out of a total of 351 students who are enrolled in schools in Eureka Springs, 50 (14.2%) attend a private institution, while the remaining 301 (85.8%) are enrolled in public schools. The age group of 18 to 19 year olds has the highest likelihood of being enrolled in private schools, with 12 (37.5% in the age bracket) enrolled. Conversely, the age group of 3 to 4 year olds has the lowest likelihood of being enrolled in a private school, with 12 (100.0% in the age bracket) attending a public institution.
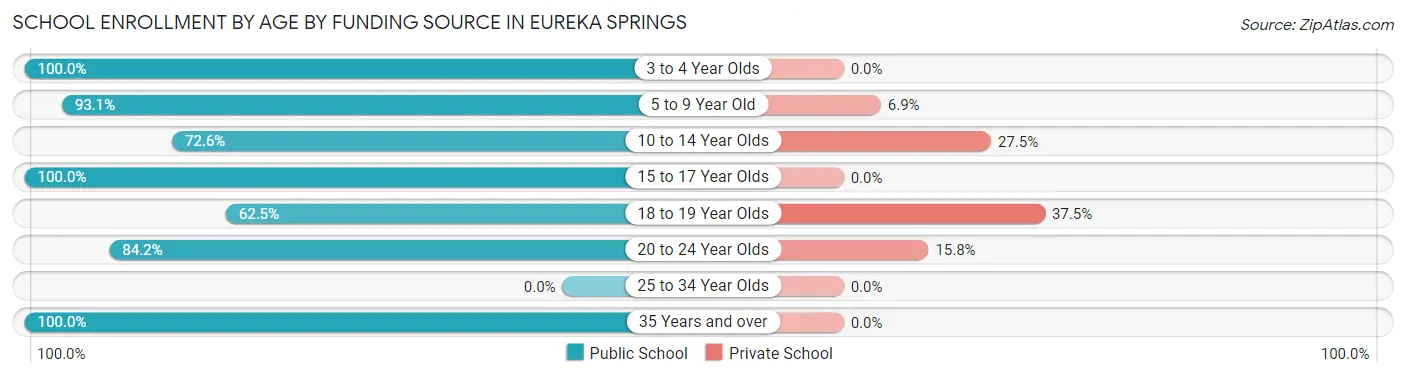
| Age Bracket | Public School | Private School |
| 3 to 4 Year Olds | 12 (100.0%) | 0 (0.0%) |
| 5 to 9 Year Old | 94 (93.1%) | 7 (6.9%) |
| 10 to 14 Year Olds | 74 (72.6%) | 28 (27.5%) |
| 15 to 17 Year Olds | 69 (100.0%) | 0 (0.0%) |
| 18 to 19 Year Olds | 20 (62.5%) | 12 (37.5%) |
| 20 to 24 Year Olds | 16 (84.2%) | 3 (15.8%) |
| 25 to 34 Year Olds | 0 (0.0%) | 0 (0.0%) |
| 35 Years and over | 16 (100.0%) | 0 (0.0%) |
| Total | 301 (85.8%) | 50 (14.2%) |
Educational Attainment by Field of Study in Eureka Springs
Business (85 | 16.9%), education (65 | 13.0%), bio, nature & agricultural (63 | 12.6%), science & technology (47 | 9.4%), and arts & humanities (47 | 9.4%) are the most common fields of study among 502 individuals in Eureka Springs who have obtained a bachelor's degree or higher.
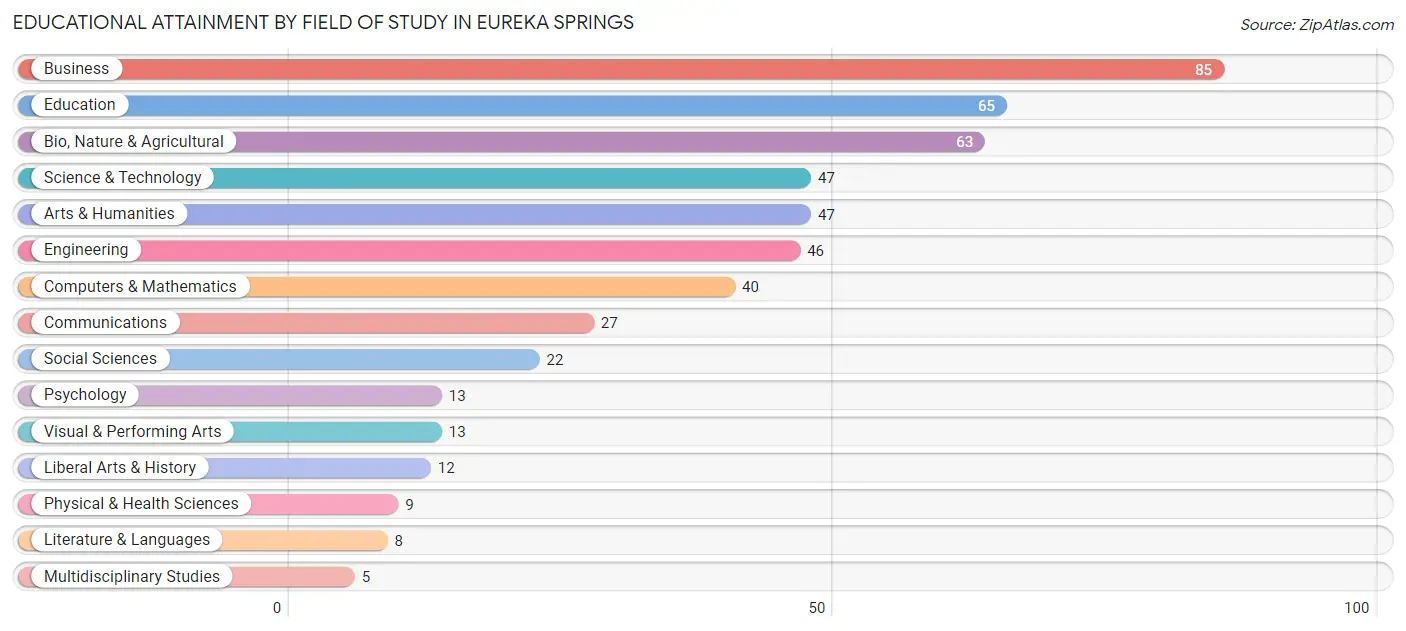
| Field of Study | # Graduates | % Graduates |
| Computers & Mathematics | 40 | 8.0% |
| Bio, Nature & Agricultural | 63 | 12.6% |
| Physical & Health Sciences | 9 | 1.8% |
| Psychology | 13 | 2.6% |
| Social Sciences | 22 | 4.4% |
| Engineering | 46 | 9.2% |
| Multidisciplinary Studies | 5 | 1.0% |
| Science & Technology | 47 | 9.4% |
| Business | 85 | 16.9% |
| Education | 65 | 13.0% |
| Literature & Languages | 8 | 1.6% |
| Liberal Arts & History | 12 | 2.4% |
| Visual & Performing Arts | 13 | 2.6% |
| Communications | 27 | 5.4% |
| Arts & Humanities | 47 | 9.4% |
| Total | 502 | 100.0% |
Transportation & Commute in Eureka Springs
Vehicle Availability by Sex in Eureka Springs
The most prevalent vehicle ownership categories in Eureka Springs are males with 2 vehicles (215, accounting for 52.6%) and females with 2 vehicles (141, making up 54.2%).
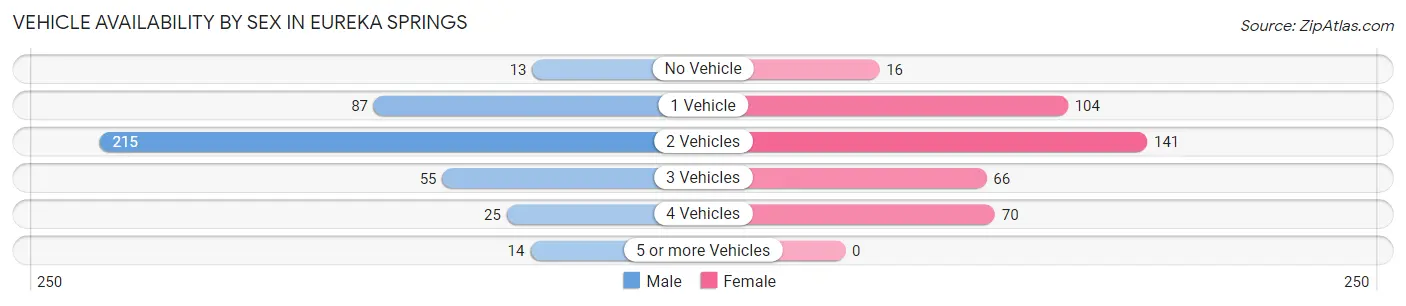
| Vehicles Available | Male | Female |
| No Vehicle | 13 (3.2%) | 16 (4.0%) |
| 1 Vehicle | 87 (21.3%) | 104 (26.2%) |
| 2 Vehicles | 215 (52.6%) | 141 (35.5%) |
| 3 Vehicles | 55 (13.5%) | 66 (16.6%) |
| 4 Vehicles | 25 (6.1%) | 70 (17.6%) |
| 5 or more Vehicles | 14 (3.4%) | 0 (0.0%) |
| Total | 409 (100.0%) | 397 (100.0%) |
Commute Time in Eureka Springs
The most frequently occuring commute durations in Eureka Springs are 10 to 14 minutes (204 commuters, 30.9%), 5 to 9 minutes (168 commuters, 25.4%), and 15 to 19 minutes (101 commuters, 15.3%).
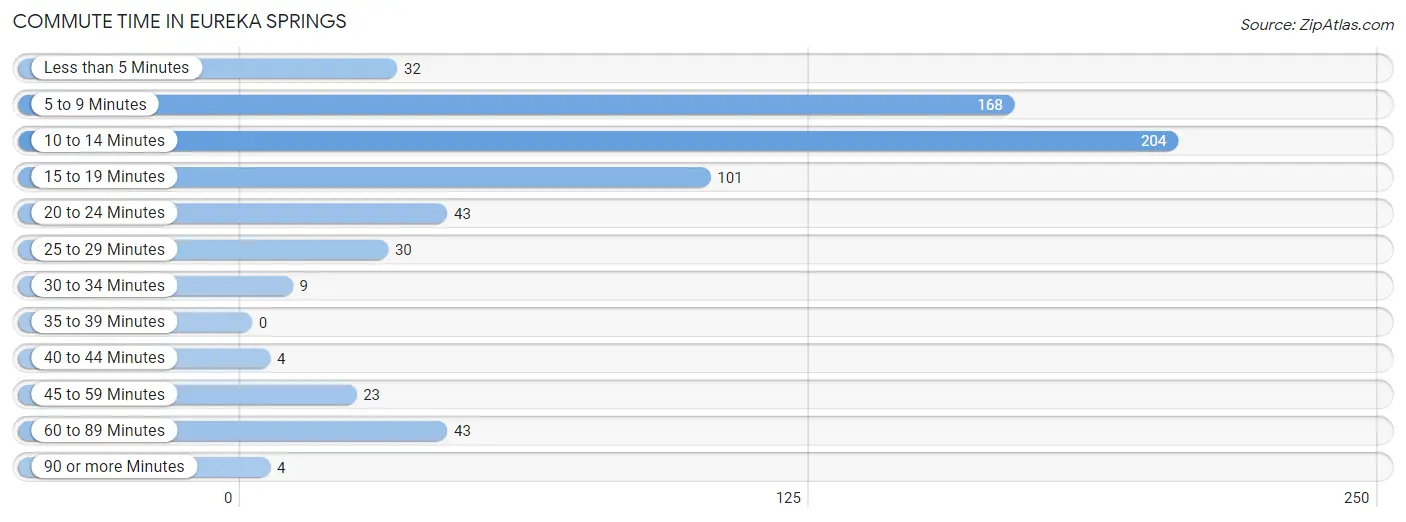
| Commute Time | # Commuters | % Commuters |
| Less than 5 Minutes | 32 | 4.8% |
| 5 to 9 Minutes | 168 | 25.4% |
| 10 to 14 Minutes | 204 | 30.9% |
| 15 to 19 Minutes | 101 | 15.3% |
| 20 to 24 Minutes | 43 | 6.5% |
| 25 to 29 Minutes | 30 | 4.5% |
| 30 to 34 Minutes | 9 | 1.4% |
| 35 to 39 Minutes | 0 | 0.0% |
| 40 to 44 Minutes | 4 | 0.6% |
| 45 to 59 Minutes | 23 | 3.5% |
| 60 to 89 Minutes | 43 | 6.5% |
| 90 or more Minutes | 4 | 0.6% |
Commute Time by Sex in Eureka Springs
The most common commute times in Eureka Springs are 10 to 14 minutes (145 commuters, 42.8%) for males and 5 to 9 minutes (100 commuters, 31.1%) for females.
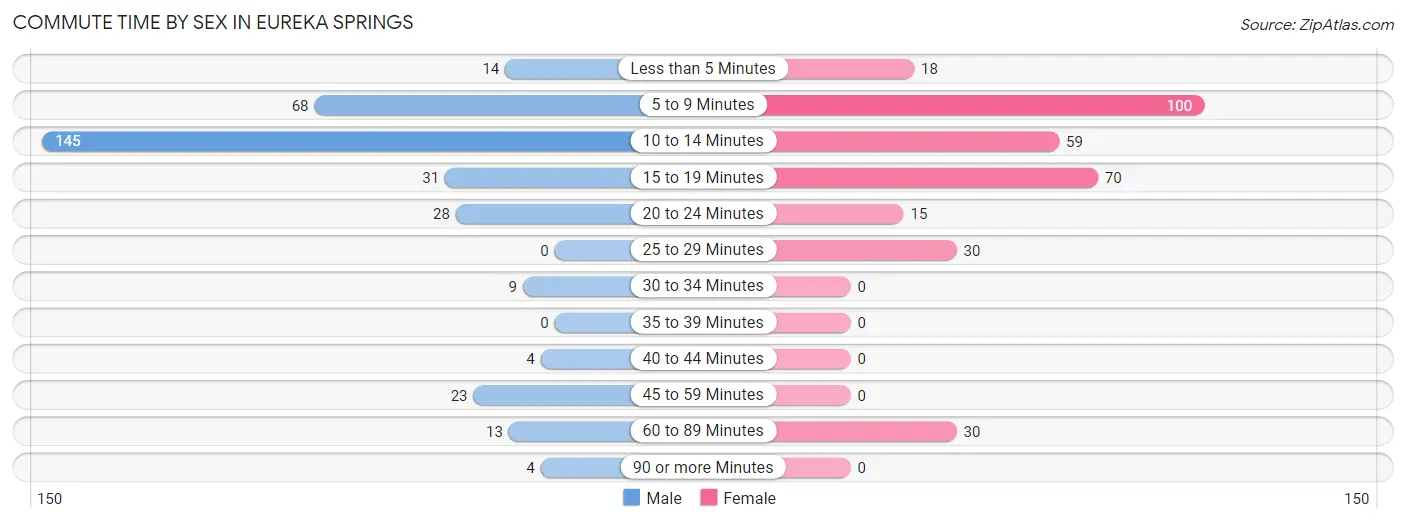
| Commute Time | Male | Female |
| Less than 5 Minutes | 14 (4.1%) | 18 (5.6%) |
| 5 to 9 Minutes | 68 (20.1%) | 100 (31.1%) |
| 10 to 14 Minutes | 145 (42.8%) | 59 (18.3%) |
| 15 to 19 Minutes | 31 (9.1%) | 70 (21.7%) |
| 20 to 24 Minutes | 28 (8.3%) | 15 (4.7%) |
| 25 to 29 Minutes | 0 (0.0%) | 30 (9.3%) |
| 30 to 34 Minutes | 9 (2.6%) | 0 (0.0%) |
| 35 to 39 Minutes | 0 (0.0%) | 0 (0.0%) |
| 40 to 44 Minutes | 4 (1.2%) | 0 (0.0%) |
| 45 to 59 Minutes | 23 (6.8%) | 0 (0.0%) |
| 60 to 89 Minutes | 13 (3.8%) | 30 (9.3%) |
| 90 or more Minutes | 4 (1.2%) | 0 (0.0%) |
Time of Departure to Work by Sex in Eureka Springs
The most frequent times of departure to work in Eureka Springs are 7:00 AM to 7:29 AM (98, 28.9%) for males and 8:00 AM to 8:29 AM (66, 20.5%) for females.
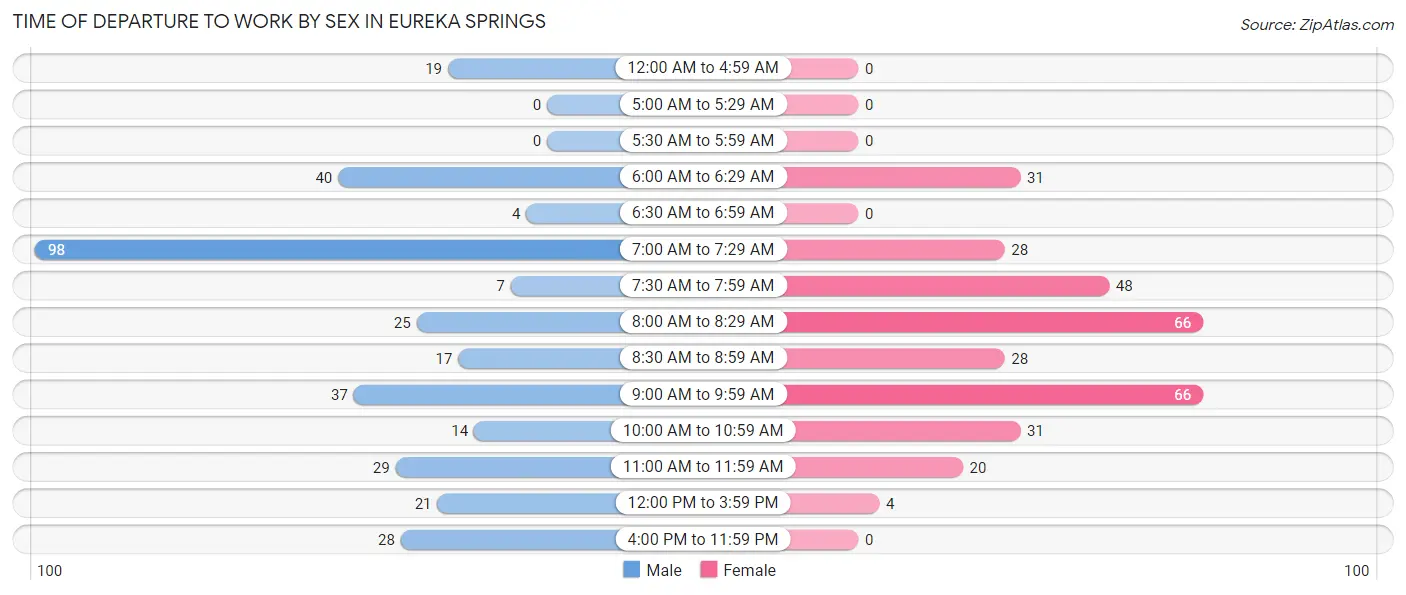
| Time of Departure | Male | Female |
| 12:00 AM to 4:59 AM | 19 (5.6%) | 0 (0.0%) |
| 5:00 AM to 5:29 AM | 0 (0.0%) | 0 (0.0%) |
| 5:30 AM to 5:59 AM | 0 (0.0%) | 0 (0.0%) |
| 6:00 AM to 6:29 AM | 40 (11.8%) | 31 (9.6%) |
| 6:30 AM to 6:59 AM | 4 (1.2%) | 0 (0.0%) |
| 7:00 AM to 7:29 AM | 98 (28.9%) | 28 (8.7%) |
| 7:30 AM to 7:59 AM | 7 (2.1%) | 48 (14.9%) |
| 8:00 AM to 8:29 AM | 25 (7.4%) | 66 (20.5%) |
| 8:30 AM to 8:59 AM | 17 (5.0%) | 28 (8.7%) |
| 9:00 AM to 9:59 AM | 37 (10.9%) | 66 (20.5%) |
| 10:00 AM to 10:59 AM | 14 (4.1%) | 31 (9.6%) |
| 11:00 AM to 11:59 AM | 29 (8.6%) | 20 (6.2%) |
| 12:00 PM to 3:59 PM | 21 (6.2%) | 4 (1.2%) |
| 4:00 PM to 11:59 PM | 28 (8.3%) | 0 (0.0%) |
| Total | 339 (100.0%) | 322 (100.0%) |
Housing Occupancy in Eureka Springs
Occupancy by Ownership in Eureka Springs
Of the total 933 dwellings in Eureka Springs, owner-occupied units account for 589 (63.1%), while renter-occupied units make up 344 (36.9%).
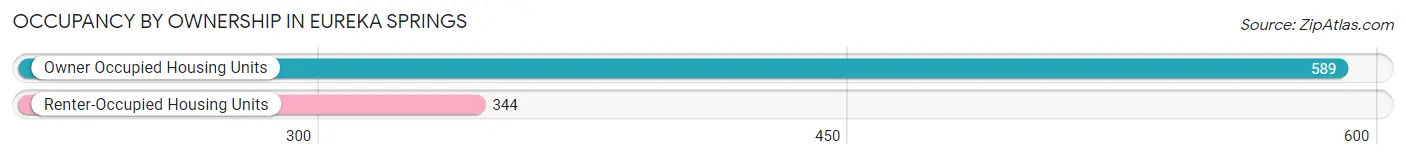
| Occupancy | # Housing Units | % Housing Units |
| Owner Occupied Housing Units | 589 | 63.1% |
| Renter-Occupied Housing Units | 344 | 36.9% |
| Total Occupied Housing Units | 933 | 100.0% |
Occupancy by Household Size in Eureka Springs
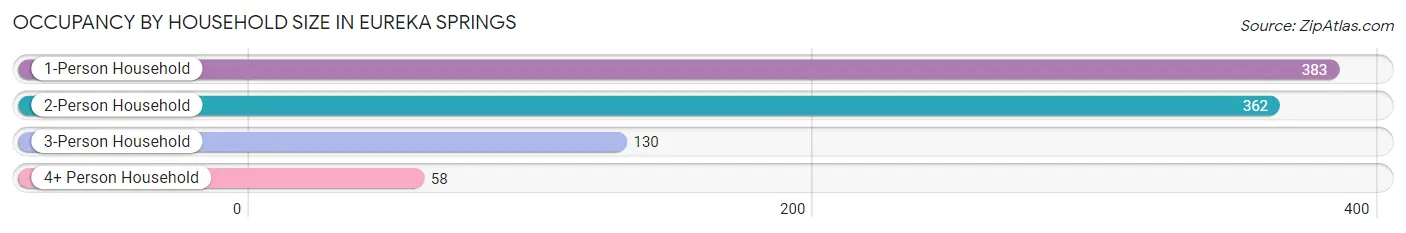
| Household Size | # Housing Units | % Housing Units |
| 1-Person Household | 383 | 41.0% |
| 2-Person Household | 362 | 38.8% |
| 3-Person Household | 130 | 13.9% |
| 4+ Person Household | 58 | 6.2% |
| Total Housing Units | 933 | 100.0% |
Occupancy by Ownership by Household Size in Eureka Springs
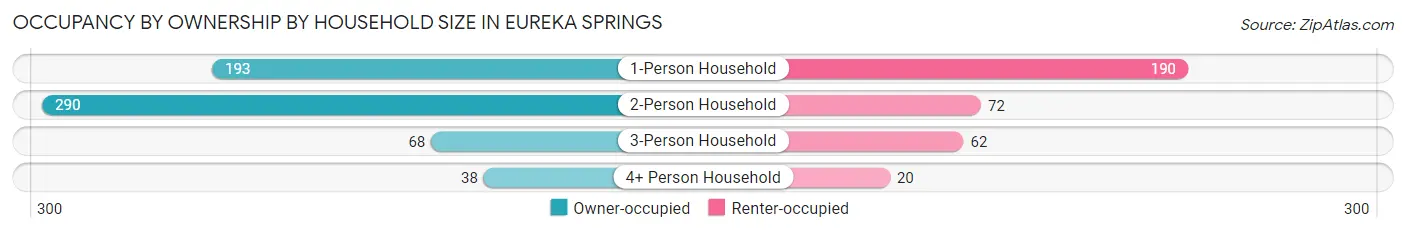
| Household Size | Owner-occupied | Renter-occupied |
| 1-Person Household | 193 (50.4%) | 190 (49.6%) |
| 2-Person Household | 290 (80.1%) | 72 (19.9%) |
| 3-Person Household | 68 (52.3%) | 62 (47.7%) |
| 4+ Person Household | 38 (65.5%) | 20 (34.5%) |
| Total Housing Units | 589 (63.1%) | 344 (36.9%) |
Occupancy by Educational Attainment in Eureka Springs
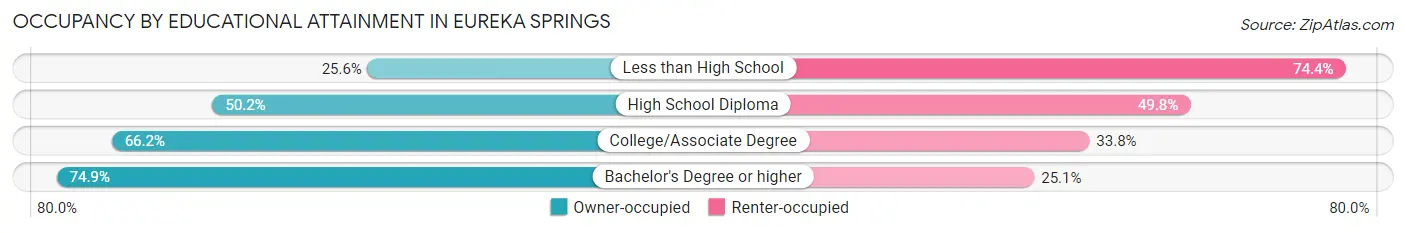
| Household Size | Owner-occupied | Renter-occupied |
| Less than High School | 11 (25.6%) | 32 (74.4%) |
| High School Diploma | 119 (50.2%) | 118 (49.8%) |
| College/Associate Degree | 229 (66.2%) | 117 (33.8%) |
| Bachelor's Degree or higher | 230 (74.9%) | 77 (25.1%) |
Occupancy by Age of Householder in Eureka Springs
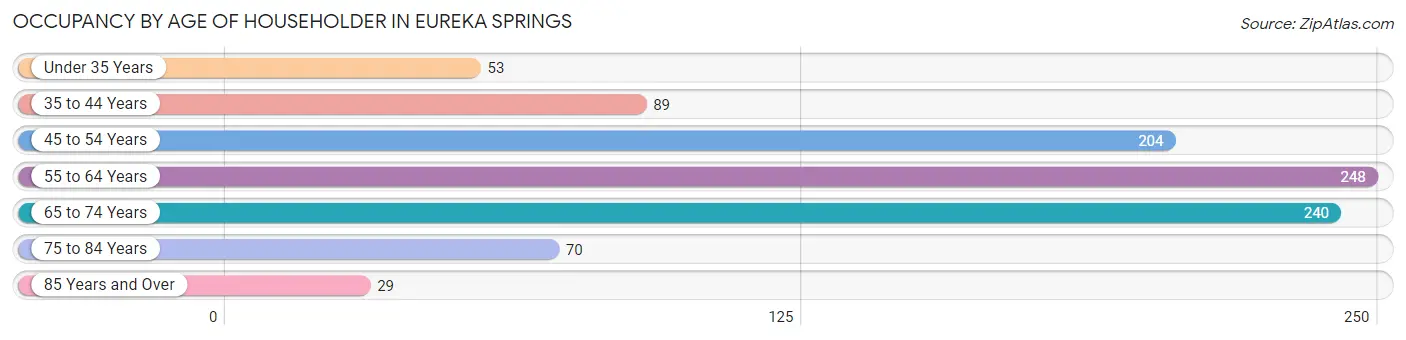
| Age Bracket | # Households | % Households |
| Under 35 Years | 53 | 5.7% |
| 35 to 44 Years | 89 | 9.5% |
| 45 to 54 Years | 204 | 21.9% |
| 55 to 64 Years | 248 | 26.6% |
| 65 to 74 Years | 240 | 25.7% |
| 75 to 84 Years | 70 | 7.5% |
| 85 Years and Over | 29 | 3.1% |
| Total | 933 | 100.0% |
Housing Finances in Eureka Springs
Median Income by Occupancy in Eureka Springs
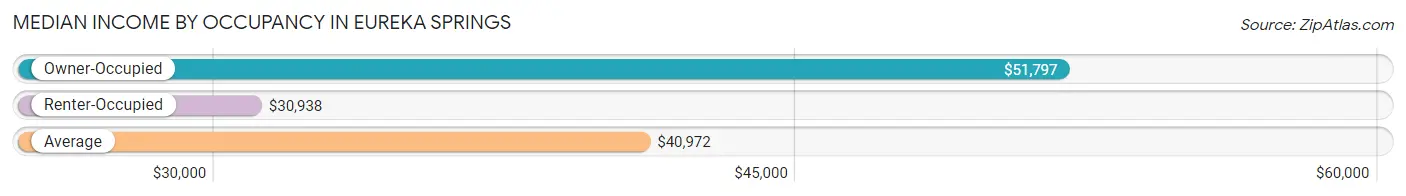
| Occupancy Type | # Households | Median Income |
| Owner-Occupied | 589 (63.1%) | $51,797 |
| Renter-Occupied | 344 (36.9%) | $30,938 |
| Average | 933 (100.0%) | $40,972 |
Occupancy by Householder Income Bracket in Eureka Springs
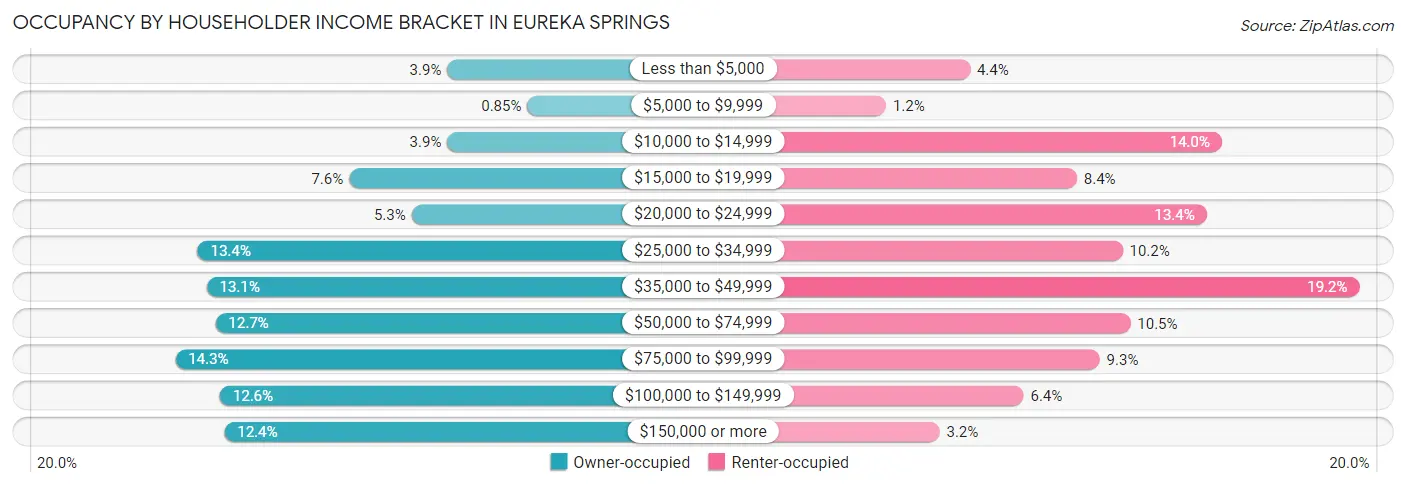
| Income Bracket | Owner-occupied | Renter-occupied |
| Less than $5,000 | 23 (3.9%) | 15 (4.4%) |
| $5,000 to $9,999 | 5 (0.9%) | 4 (1.2%) |
| $10,000 to $14,999 | 23 (3.9%) | 48 (14.0%) |
| $15,000 to $19,999 | 45 (7.6%) | 29 (8.4%) |
| $20,000 to $24,999 | 31 (5.3%) | 46 (13.4%) |
| $25,000 to $34,999 | 79 (13.4%) | 35 (10.2%) |
| $35,000 to $49,999 | 77 (13.1%) | 66 (19.2%) |
| $50,000 to $74,999 | 75 (12.7%) | 36 (10.5%) |
| $75,000 to $99,999 | 84 (14.3%) | 32 (9.3%) |
| $100,000 to $149,999 | 74 (12.6%) | 22 (6.4%) |
| $150,000 or more | 73 (12.4%) | 11 (3.2%) |
| Total | 589 (100.0%) | 344 (100.0%) |
Monthly Housing Cost Tiers in Eureka Springs
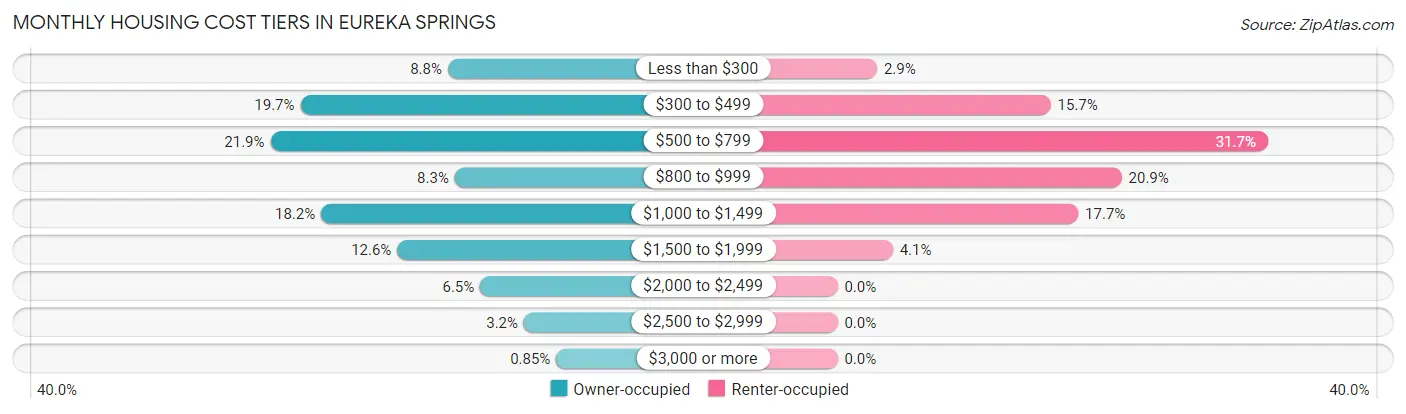
| Monthly Cost | Owner-occupied | Renter-occupied |
| Less than $300 | 52 (8.8%) | 10 (2.9%) |
| $300 to $499 | 116 (19.7%) | 54 (15.7%) |
| $500 to $799 | 129 (21.9%) | 109 (31.7%) |
| $800 to $999 | 49 (8.3%) | 72 (20.9%) |
| $1,000 to $1,499 | 107 (18.2%) | 61 (17.7%) |
| $1,500 to $1,999 | 74 (12.6%) | 14 (4.1%) |
| $2,000 to $2,499 | 38 (6.5%) | 0 (0.0%) |
| $2,500 to $2,999 | 19 (3.2%) | 0 (0.0%) |
| $3,000 or more | 5 (0.9%) | 0 (0.0%) |
| Total | 589 (100.0%) | 344 (100.0%) |
Physical Housing Characteristics in Eureka Springs
Housing Structures in Eureka Springs
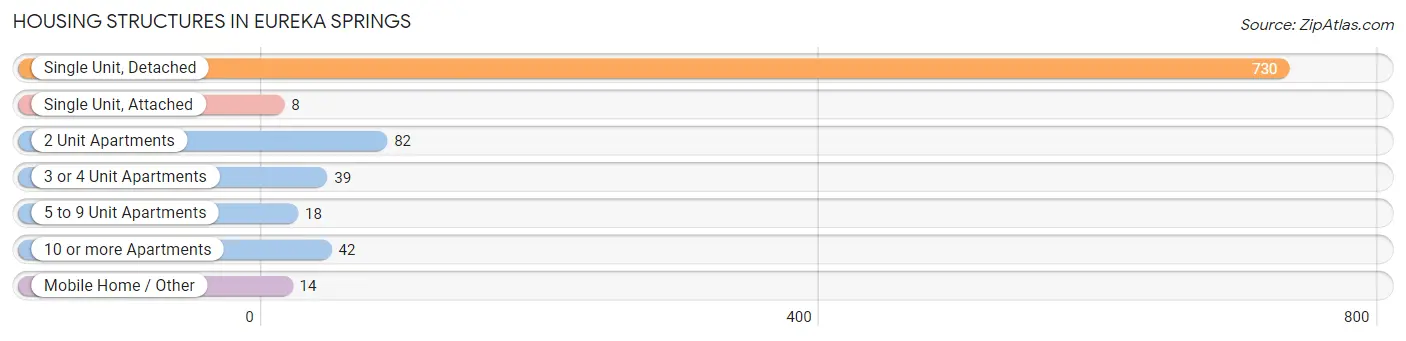
| Structure Type | # Housing Units | % Housing Units |
| Single Unit, Detached | 730 | 78.2% |
| Single Unit, Attached | 8 | 0.9% |
| 2 Unit Apartments | 82 | 8.8% |
| 3 or 4 Unit Apartments | 39 | 4.2% |
| 5 to 9 Unit Apartments | 18 | 1.9% |
| 10 or more Apartments | 42 | 4.5% |
| Mobile Home / Other | 14 | 1.5% |
| Total | 933 | 100.0% |
Housing Structures by Occupancy in Eureka Springs
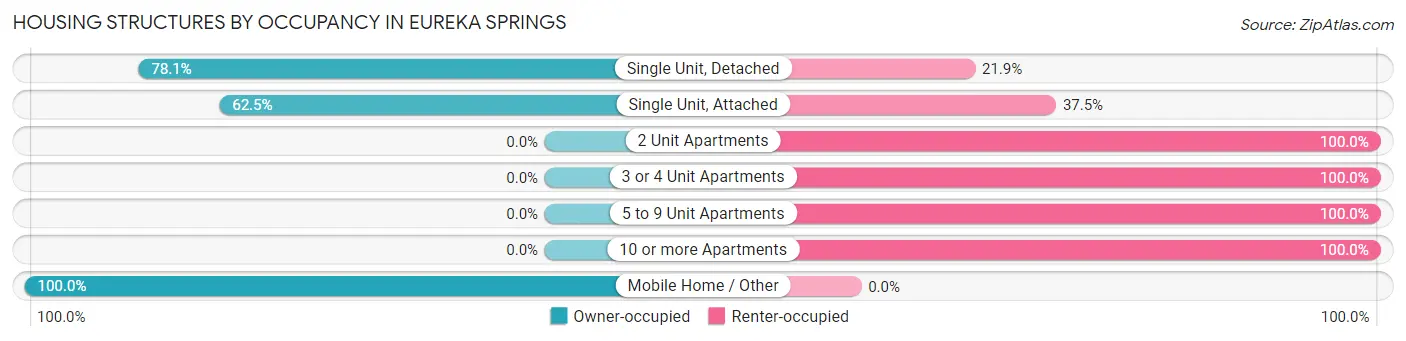
| Structure Type | Owner-occupied | Renter-occupied |
| Single Unit, Detached | 570 (78.1%) | 160 (21.9%) |
| Single Unit, Attached | 5 (62.5%) | 3 (37.5%) |
| 2 Unit Apartments | 0 (0.0%) | 82 (100.0%) |
| 3 or 4 Unit Apartments | 0 (0.0%) | 39 (100.0%) |
| 5 to 9 Unit Apartments | 0 (0.0%) | 18 (100.0%) |
| 10 or more Apartments | 0 (0.0%) | 42 (100.0%) |
| Mobile Home / Other | 14 (100.0%) | 0 (0.0%) |
| Total | 589 (63.1%) | 344 (36.9%) |
Housing Structures by Number of Rooms in Eureka Springs
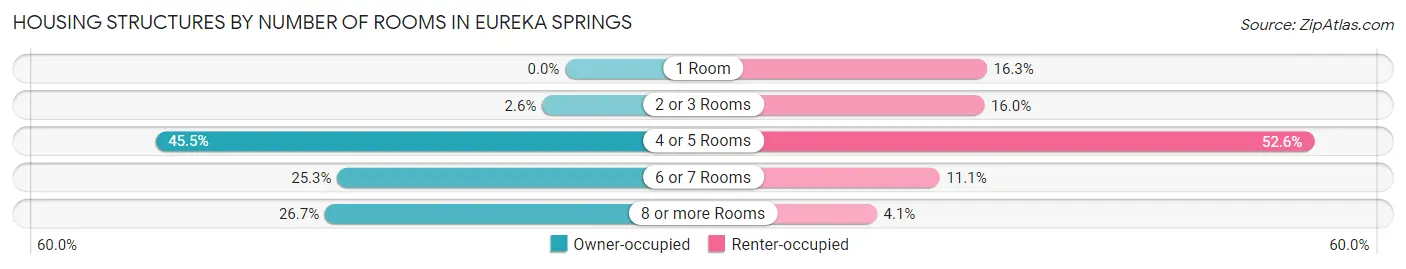
| Number of Rooms | Owner-occupied | Renter-occupied |
| 1 Room | 0 (0.0%) | 56 (16.3%) |
| 2 or 3 Rooms | 15 (2.5%) | 55 (16.0%) |
| 4 or 5 Rooms | 268 (45.5%) | 181 (52.6%) |
| 6 or 7 Rooms | 149 (25.3%) | 38 (11.1%) |
| 8 or more Rooms | 157 (26.7%) | 14 (4.1%) |
| Total | 589 (100.0%) | 344 (100.0%) |
Housing Structure by Heating Type in Eureka Springs
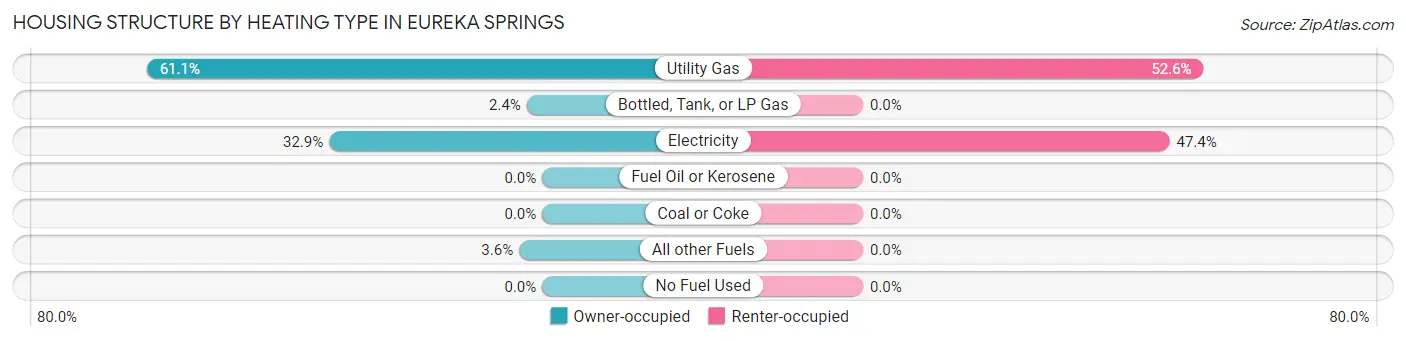
| Heating Type | Owner-occupied | Renter-occupied |
| Utility Gas | 360 (61.1%) | 181 (52.6%) |
| Bottled, Tank, or LP Gas | 14 (2.4%) | 0 (0.0%) |
| Electricity | 194 (32.9%) | 163 (47.4%) |
| Fuel Oil or Kerosene | 0 (0.0%) | 0 (0.0%) |
| Coal or Coke | 0 (0.0%) | 0 (0.0%) |
| All other Fuels | 21 (3.6%) | 0 (0.0%) |
| No Fuel Used | 0 (0.0%) | 0 (0.0%) |
| Total | 589 (100.0%) | 344 (100.0%) |
Household Vehicle Usage in Eureka Springs
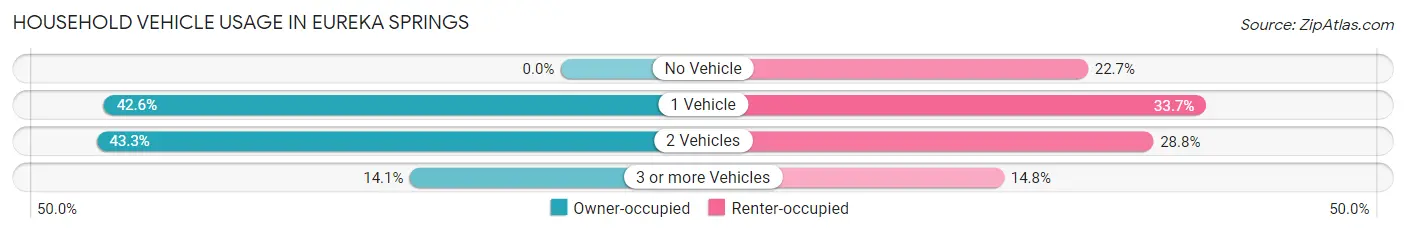
| Vehicles per Household | Owner-occupied | Renter-occupied |
| No Vehicle | 0 (0.0%) | 78 (22.7%) |
| 1 Vehicle | 251 (42.6%) | 116 (33.7%) |
| 2 Vehicles | 255 (43.3%) | 99 (28.8%) |
| 3 or more Vehicles | 83 (14.1%) | 51 (14.8%) |
| Total | 589 (100.0%) | 344 (100.0%) |
Real Estate & Mortgages in Eureka Springs
Real Estate and Mortgage Overview in Eureka Springs
| Characteristic | Without Mortgage | With Mortgage |
| Housing Units | 247 | 342 |
| Median Property Value | $212,500 | $223,800 |
| Median Household Income | $39,583 | $29 |
| Monthly Housing Costs | $435 | $5 |
| Real Estate Taxes | $1,527 | $4 |
Property Value by Mortgage Status in Eureka Springs
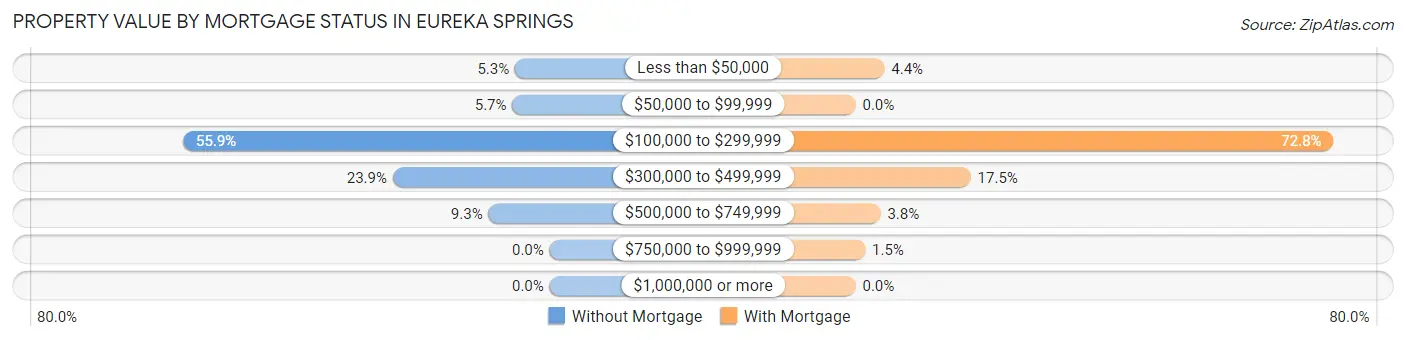
| Property Value | Without Mortgage | With Mortgage |
| Less than $50,000 | 13 (5.3%) | 15 (4.4%) |
| $50,000 to $99,999 | 14 (5.7%) | 0 (0.0%) |
| $100,000 to $299,999 | 138 (55.9%) | 249 (72.8%) |
| $300,000 to $499,999 | 59 (23.9%) | 60 (17.5%) |
| $500,000 to $749,999 | 23 (9.3%) | 13 (3.8%) |
| $750,000 to $999,999 | 0 (0.0%) | 5 (1.5%) |
| $1,000,000 or more | 0 (0.0%) | 0 (0.0%) |
| Total | 247 (100.0%) | 342 (100.0%) |
Household Income by Mortgage Status in Eureka Springs
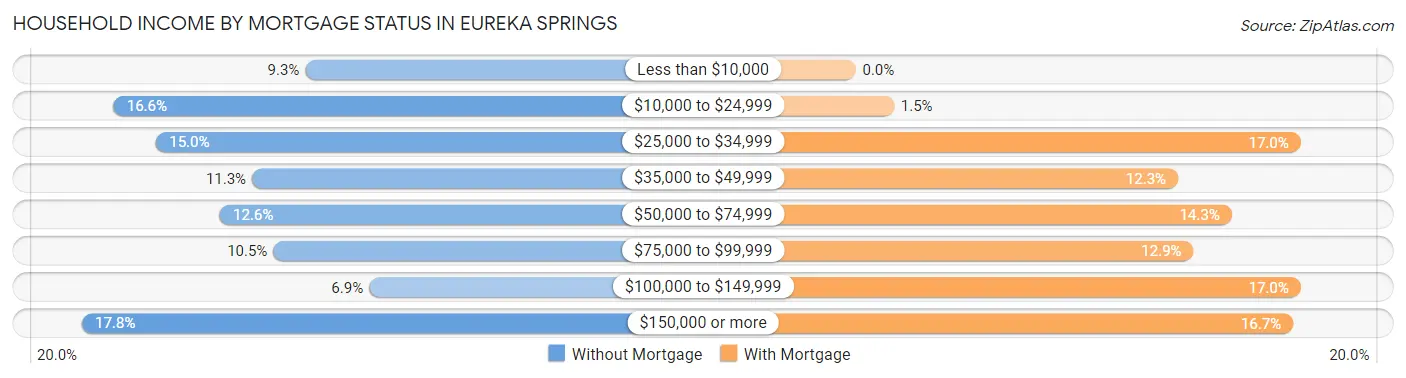
| Household Income | Without Mortgage | With Mortgage |
| Less than $10,000 | 23 (9.3%) | 0 (0.0%) |
| $10,000 to $24,999 | 41 (16.6%) | 5 (1.5%) |
| $25,000 to $34,999 | 37 (15.0%) | 58 (17.0%) |
| $35,000 to $49,999 | 28 (11.3%) | 42 (12.3%) |
| $50,000 to $74,999 | 31 (12.6%) | 49 (14.3%) |
| $75,000 to $99,999 | 26 (10.5%) | 44 (12.9%) |
| $100,000 to $149,999 | 17 (6.9%) | 58 (17.0%) |
| $150,000 or more | 44 (17.8%) | 57 (16.7%) |
| Total | 247 (100.0%) | 342 (100.0%) |
Property Value to Household Income Ratio in Eureka Springs
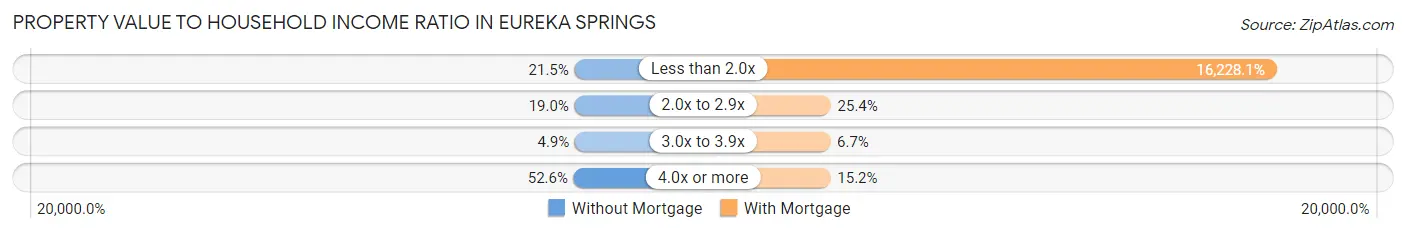
| Value-to-Income Ratio | Without Mortgage | With Mortgage |
| Less than 2.0x | 53 (21.5%) | 55,500 (16,228.1%) |
| 2.0x to 2.9x | 47 (19.0%) | 87 (25.4%) |
| 3.0x to 3.9x | 12 (4.9%) | 23 (6.7%) |
| 4.0x or more | 130 (52.6%) | 52 (15.2%) |
| Total | 247 (100.0%) | 342 (100.0%) |
Real Estate Taxes by Mortgage Status in Eureka Springs
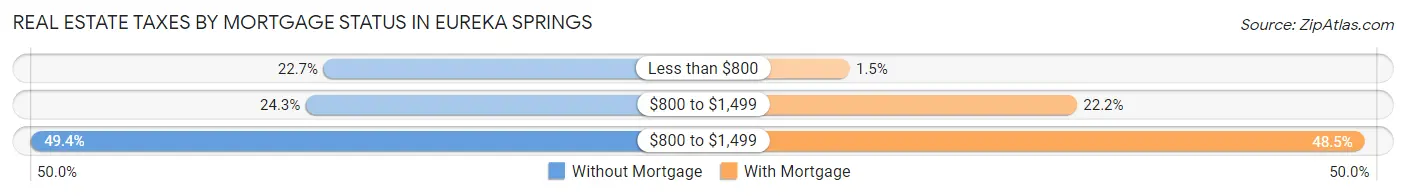
| Property Taxes | Without Mortgage | With Mortgage |
| Less than $800 | 56 (22.7%) | 5 (1.5%) |
| $800 to $1,499 | 60 (24.3%) | 76 (22.2%) |
| $800 to $1,499 | 122 (49.4%) | 166 (48.5%) |
| Total | 247 (100.0%) | 342 (100.0%) |
Health & Disability in Eureka Springs
Health Insurance Coverage by Age in Eureka Springs
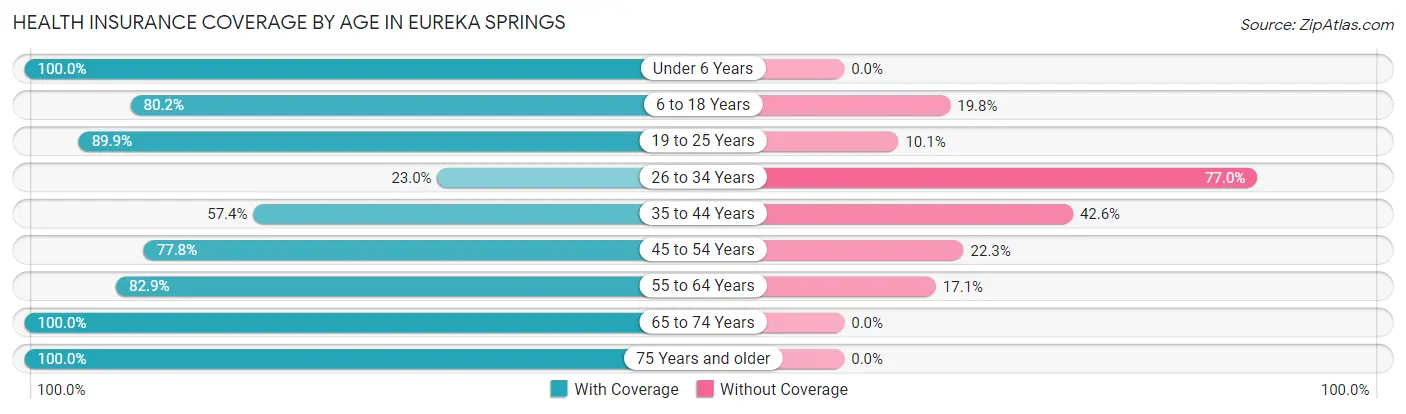
| Age Bracket | With Coverage | Without Coverage |
| Under 6 Years | 118 (100.0%) | 0 (0.0%) |
| 6 to 18 Years | 207 (80.2%) | 51 (19.8%) |
| 19 to 25 Years | 89 (89.9%) | 10 (10.1%) |
| 26 to 34 Years | 26 (23.0%) | 87 (77.0%) |
| 35 to 44 Years | 113 (57.4%) | 84 (42.6%) |
| 45 to 54 Years | 276 (77.7%) | 79 (22.3%) |
| 55 to 64 Years | 301 (82.9%) | 62 (17.1%) |
| 65 to 74 Years | 360 (100.0%) | 0 (0.0%) |
| 75 Years and older | 136 (100.0%) | 0 (0.0%) |
| Total | 1,626 (81.3%) | 373 (18.7%) |
Health Insurance Coverage by Citizenship Status in Eureka Springs
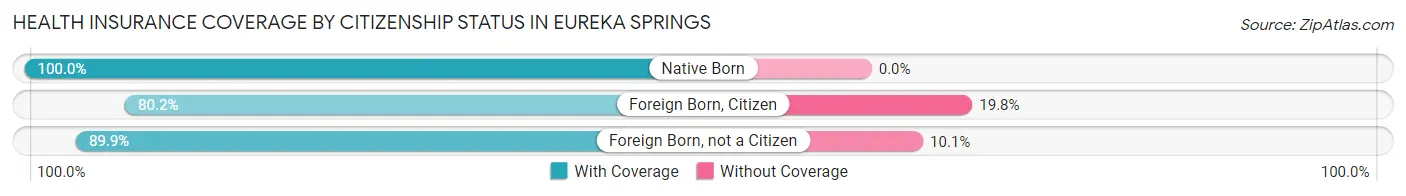
| Citizenship Status | With Coverage | Without Coverage |
| Native Born | 118 (100.0%) | 0 (0.0%) |
| Foreign Born, Citizen | 207 (80.2%) | 51 (19.8%) |
| Foreign Born, not a Citizen | 89 (89.9%) | 10 (10.1%) |
Health Insurance Coverage by Household Income in Eureka Springs
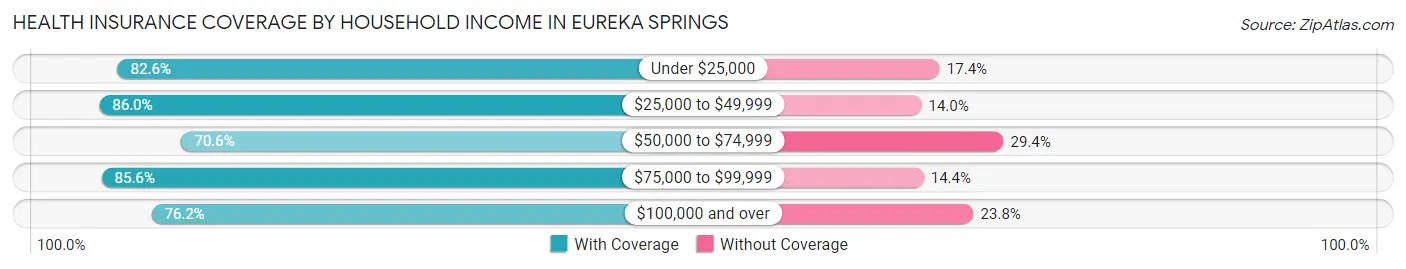
| Household Income | With Coverage | Without Coverage |
| Under $25,000 | 284 (82.6%) | 60 (17.4%) |
| $25,000 to $49,999 | 485 (86.0%) | 79 (14.0%) |
| $50,000 to $74,999 | 202 (70.6%) | 84 (29.4%) |
| $75,000 to $99,999 | 344 (85.6%) | 58 (14.4%) |
| $100,000 and over | 295 (76.2%) | 92 (23.8%) |
Public vs Private Health Insurance Coverage by Age in Eureka Springs
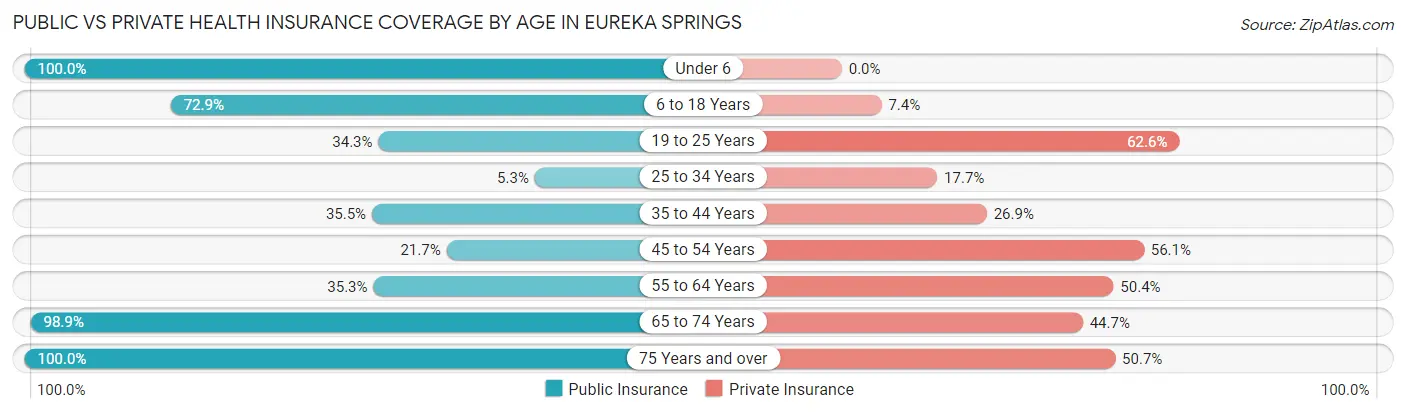
| Age Bracket | Public Insurance | Private Insurance |
| Under 6 | 118 (100.0%) | 0 (0.0%) |
| 6 to 18 Years | 188 (72.9%) | 19 (7.4%) |
| 19 to 25 Years | 34 (34.3%) | 62 (62.6%) |
| 25 to 34 Years | 6 (5.3%) | 20 (17.7%) |
| 35 to 44 Years | 70 (35.5%) | 53 (26.9%) |
| 45 to 54 Years | 77 (21.7%) | 199 (56.1%) |
| 55 to 64 Years | 128 (35.3%) | 183 (50.4%) |
| 65 to 74 Years | 356 (98.9%) | 161 (44.7%) |
| 75 Years and over | 136 (100.0%) | 69 (50.7%) |
| Total | 1,113 (55.7%) | 766 (38.3%) |
Disability Status by Sex by Age in Eureka Springs
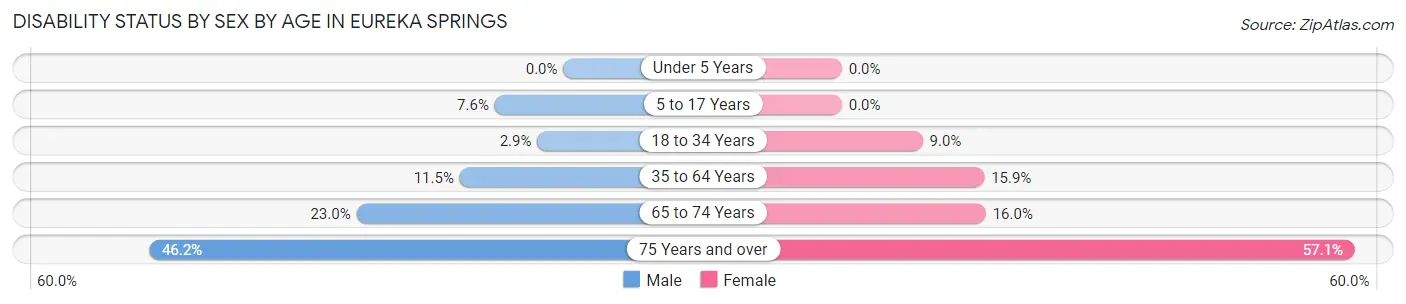
| Age Bracket | Male | Female |
| Under 5 Years | 0 (0.0%) | 0 (0.0%) |
| 5 to 17 Years | 11 (7.6%) | 0 (0.0%) |
| 18 to 34 Years | 4 (2.9%) | 9 (9.0%) |
| 35 to 64 Years | 51 (11.5%) | 75 (15.9%) |
| 65 to 74 Years | 47 (23.0%) | 25 (16.0%) |
| 75 Years and over | 24 (46.2%) | 48 (57.1%) |
Disability Class by Sex by Age in Eureka Springs
Disability Class: Hearing Difficulty
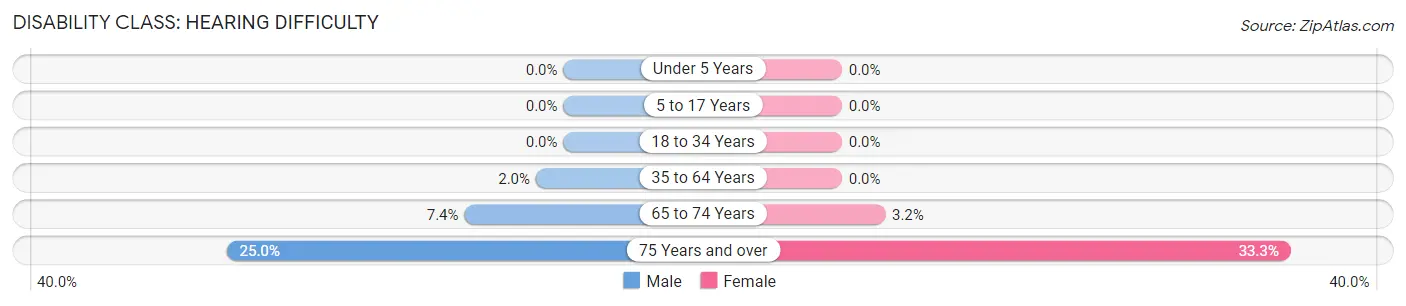
| Age Bracket | Male | Female |
| Under 5 Years | 0 (0.0%) | 0 (0.0%) |
| 5 to 17 Years | 0 (0.0%) | 0 (0.0%) |
| 18 to 34 Years | 0 (0.0%) | 0 (0.0%) |
| 35 to 64 Years | 9 (2.0%) | 0 (0.0%) |
| 65 to 74 Years | 15 (7.3%) | 5 (3.2%) |
| 75 Years and over | 13 (25.0%) | 28 (33.3%) |
Disability Class: Vision Difficulty
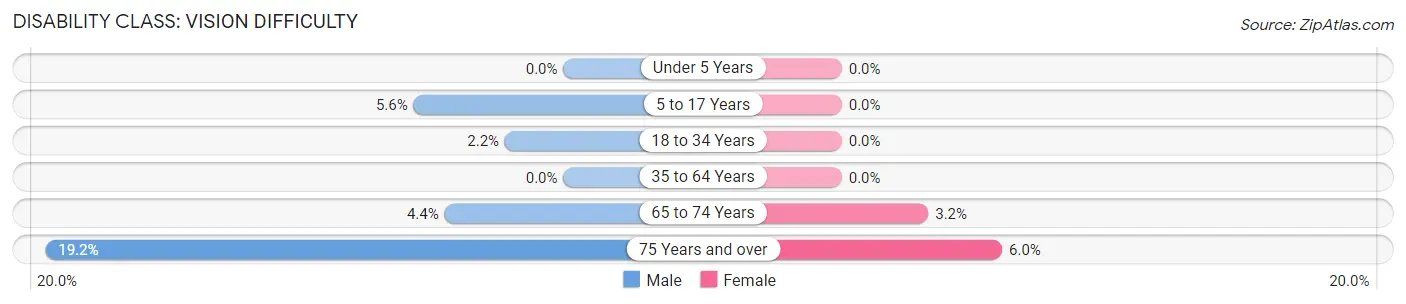
| Age Bracket | Male | Female |
| Under 5 Years | 0 (0.0%) | 0 (0.0%) |
| 5 to 17 Years | 8 (5.6%) | 0 (0.0%) |
| 18 to 34 Years | 3 (2.2%) | 0 (0.0%) |
| 35 to 64 Years | 0 (0.0%) | 0 (0.0%) |
| 65 to 74 Years | 9 (4.4%) | 5 (3.2%) |
| 75 Years and over | 10 (19.2%) | 5 (5.9%) |
Disability Class: Cognitive Difficulty
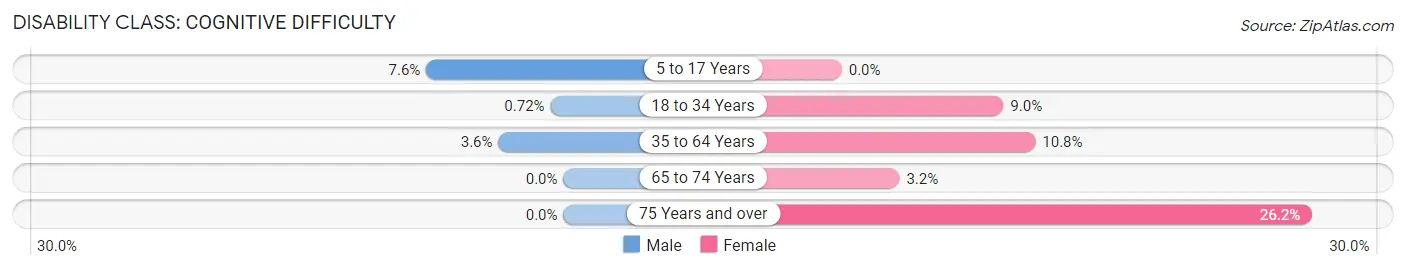
| Age Bracket | Male | Female |
| 5 to 17 Years | 11 (7.6%) | 0 (0.0%) |
| 18 to 34 Years | 1 (0.7%) | 9 (9.0%) |
| 35 to 64 Years | 16 (3.6%) | 51 (10.8%) |
| 65 to 74 Years | 0 (0.0%) | 5 (3.2%) |
| 75 Years and over | 0 (0.0%) | 22 (26.2%) |
Disability Class: Ambulatory Difficulty
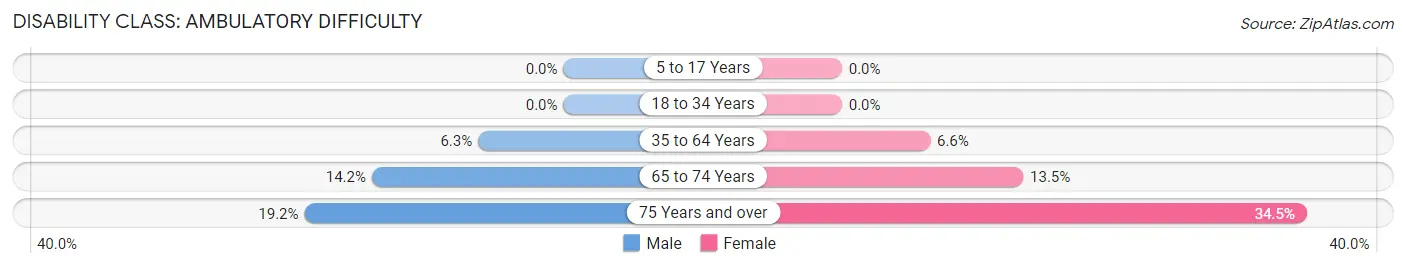
| Age Bracket | Male | Female |
| 5 to 17 Years | 0 (0.0%) | 0 (0.0%) |
| 18 to 34 Years | 0 (0.0%) | 0 (0.0%) |
| 35 to 64 Years | 28 (6.3%) | 31 (6.6%) |
| 65 to 74 Years | 29 (14.2%) | 21 (13.5%) |
| 75 Years and over | 10 (19.2%) | 29 (34.5%) |
Disability Class: Self-Care Difficulty
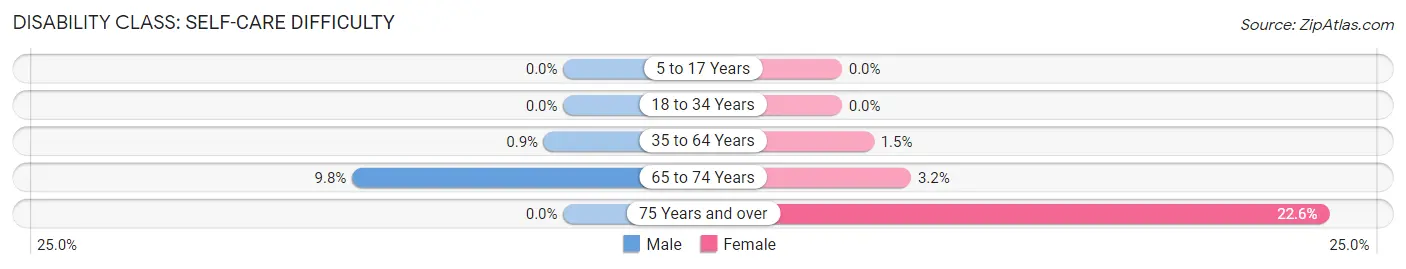
| Age Bracket | Male | Female |
| 5 to 17 Years | 0 (0.0%) | 0 (0.0%) |
| 18 to 34 Years | 0 (0.0%) | 0 (0.0%) |
| 35 to 64 Years | 4 (0.9%) | 7 (1.5%) |
| 65 to 74 Years | 20 (9.8%) | 5 (3.2%) |
| 75 Years and over | 0 (0.0%) | 19 (22.6%) |
Technology Access in Eureka Springs
Computing Device Access in Eureka Springs
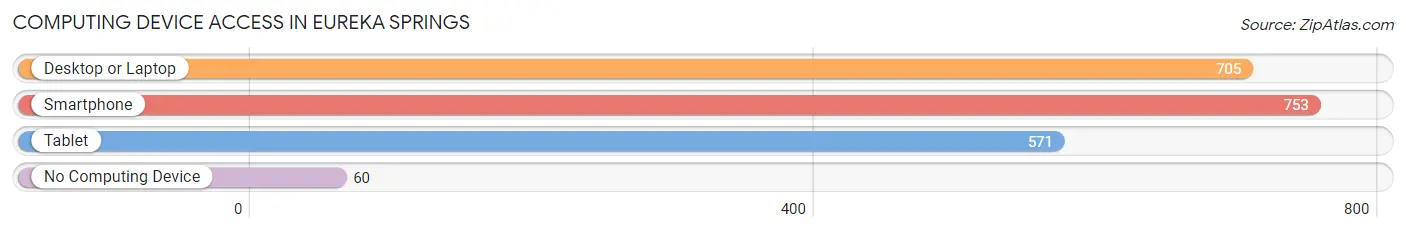
| Device Type | # Households | % Households |
| Desktop or Laptop | 705 | 75.6% |
| Smartphone | 753 | 80.7% |
| Tablet | 571 | 61.2% |
| No Computing Device | 60 | 6.4% |
| Total | 933 | 100.0% |
Internet Access in Eureka Springs
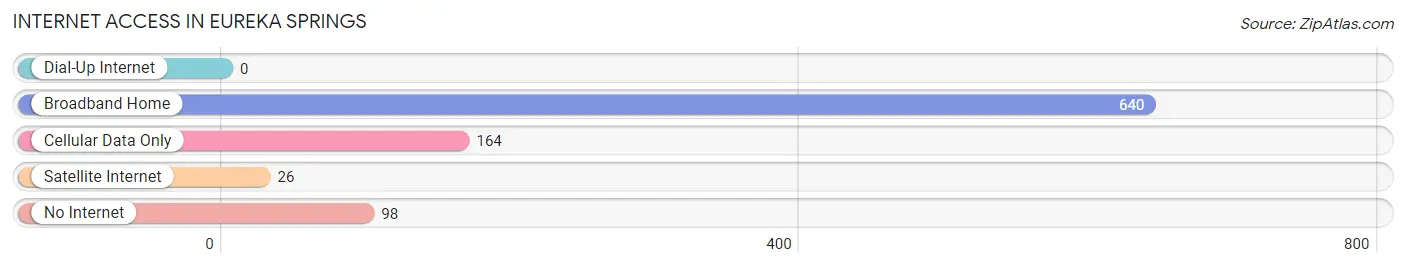
| Internet Type | # Households | % Households |
| Dial-Up Internet | 0 | 0.0% |
| Broadband Home | 640 | 68.6% |
| Cellular Data Only | 164 | 17.6% |
| Satellite Internet | 26 | 2.8% |
| No Internet | 98 | 10.5% |
| Total | 933 | 100.0% |
Eureka Springs Summary
Eureka Springs, Arkansas is a small city located in the Ozark Mountains of Northwest Arkansas. It is known for its Victorian architecture, natural springs, and unique culture. The city has a population of 2,073 as of the 2010 census, and is the county seat of Carroll County.
History
Eureka Springs was founded in 1879 by a group of settlers led by Judge J.B. Saunders. The city was named after the natural springs that were discovered in the area. The springs were believed to have healing properties, and the city quickly became a popular destination for those seeking health and relaxation.
In the late 19th century, Eureka Springs was a popular tourist destination, and the city was known for its grand hotels and spas. The city was also home to a thriving arts and culture scene, and was known for its unique architecture.
In the early 20th century, the city experienced a decline in tourism due to the Great Depression and World War II. However, the city experienced a resurgence in the 1950s and 1960s, when it became a popular destination for hippies and artists.
Geography
Eureka Springs is located in the Ozark Mountains of Northwest Arkansas. The city is situated in the White River Valley, and is surrounded by the Ozark National Forest. The city is located at an elevation of 1,200 feet, and has a total area of 2.3 square miles.
The city is located near the Arkansas-Missouri border, and is approximately 60 miles from Fayetteville, Arkansas and 70 miles from Springfield, Missouri.
Economy
Eureka Springs is a popular tourist destination, and the city’s economy is largely driven by tourism. The city is home to numerous hotels, restaurants, and attractions, and is known for its unique culture and architecture.
The city is also home to a number of small businesses, including art galleries, antique stores, and specialty shops. The city is also home to a number of manufacturing companies, including a furniture factory and a printing company.
Demographics
As of the 2010 census, Eureka Springs had a population of 2,073. The city has a median age of 44.7, and a median household income of $37,917. The city is predominantly white, with 87.3% of the population identifying as white. The city also has a small Hispanic population, with 4.3% of the population identifying as Hispanic or Latino.
Conclusion
Eureka Springs, Arkansas is a small city located in the Ozark Mountains of Northwest Arkansas. It is known for its Victorian architecture, natural springs, and unique culture. The city has a population of 2,073 as of the 2010 census, and is the county seat of Carroll County. The city’s economy is largely driven by tourism, and the city is home to numerous hotels, restaurants, and attractions. The city is predominantly white, with 87.3% of the population identifying as white. The city also has a small Hispanic population, with 4.3% of the population identifying as Hispanic or Latino.
Common Questions
What is Per Capita Income in Eureka Springs?
Per Capita income in Eureka Springs is $31,355.
What is the Median Family Income in Eureka Springs?
Median Family Income in Eureka Springs is $66,500.
What is the Median Household income in Eureka Springs?
Median Household Income in Eureka Springs is $40,972.
What is Income or Wage Gap in Eureka Springs?
Income or Wage Gap in Eureka Springs is 14.2%.
Women in Eureka Springs earn 85.8 cents for every dollar earned by a man.
What is Inequality or Gini Index in Eureka Springs?
Inequality or Gini Index in Eureka Springs is 0.50.
What is the Total Population of Eureka Springs?
Total Population of Eureka Springs is 2,053.
What is the Total Male Population of Eureka Springs?
Total Male Population of Eureka Springs is 1,024.
What is the Total Female Population of Eureka Springs?
Total Female Population of Eureka Springs is 1,029.
What is the Ratio of Males per 100 Females in Eureka Springs?
There are 99.51 Males per 100 Females in Eureka Springs.
What is the Ratio of Females per 100 Males in Eureka Springs?
There are 100.49 Females per 100 Males in Eureka Springs.
What is the Median Population Age in Eureka Springs?
Median Population Age in Eureka Springs is 52.0 Years.
What is the Average Family Size in Eureka Springs
Average Family Size in Eureka Springs is 2.9 People.
What is the Average Household Size in Eureka Springs
Average Household Size in Eureka Springs is 2.1 People.
How Large is the Labor Force in Eureka Springs?
There are 821 People in the Labor Forcein in Eureka Springs.
What is the Percentage of People in the Labor Force in Eureka Springs?
46.6% of People are in the Labor Force in Eureka Springs.
What is the Unemployment Rate in Eureka Springs?
Unemployment Rate in Eureka Springs is 1.1%.