Zip Codes with the Highest Percentage of Population Employed in Security & Protection in Benton, AR
RELATED REPORTS & OPTIONS
Security & Protection
Benton
Compare Zip Codes
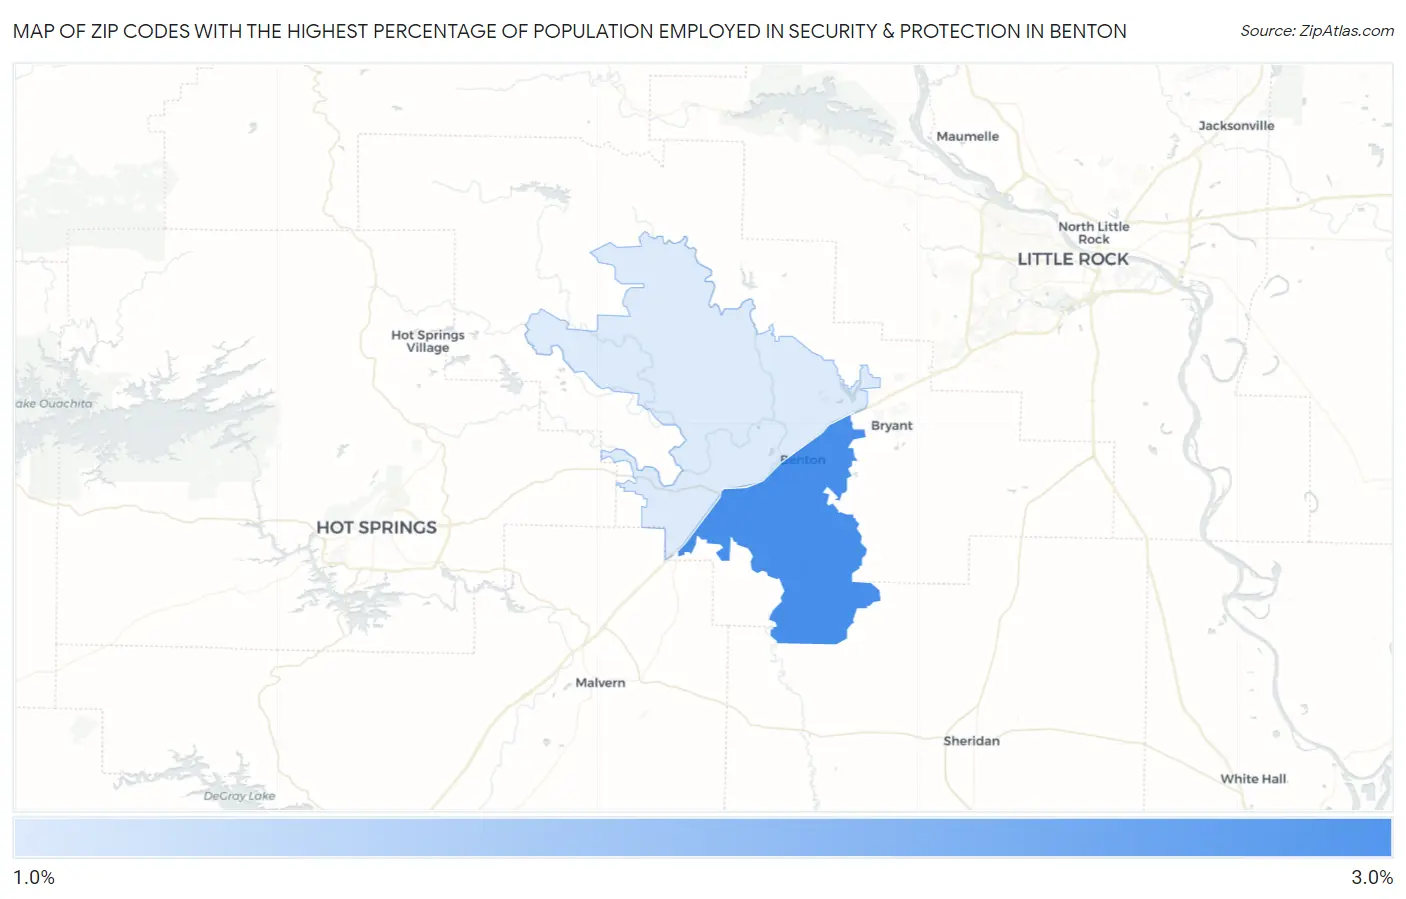
Map of Zip Codes with the Highest Percentage of Population Employed in Security & Protection in Benton
1.4%
2.6%
Zip Codes with the Highest Percentage of Population Employed in Security & Protection in Benton, AR
| Zip Code | % Employed | vs State | vs National | |
| 1. | 72015 | 2.6% | 2.0%(+0.626)#155 | 2.1%(+0.482)#8,874 |
| 2. | 72019 | 1.4% | 2.0%(-0.565)#258 | 2.1%(-0.709)#16,668 |
1
Common Questions
What are the Top Zip Codes with the Highest Percentage of Population Employed in Security & Protection in Benton, AR?
Top Zip Codes with the Highest Percentage of Population Employed in Security & Protection in Benton, AR are:
What zip code has the Highest Percentage of Population Employed in Security & Protection in Benton, AR?
72015 has the Highest Percentage of Population Employed in Security & Protection in Benton, AR with 2.6%.
What is the Percentage of Population Employed in Security & Protection in Benton, AR?
Percentage of Population Employed in Security & Protection in Benton is 2.0%.
What is the Percentage of Population Employed in Security & Protection in Arkansas?
Percentage of Population Employed in Security & Protection in Arkansas is 2.0%.
What is the Percentage of Population Employed in Security & Protection in the United States?
Percentage of Population Employed in Security & Protection in the United States is 2.1%.