Zip Codes with the Highest Percentage of Population Employed in Farming, Fishing & Forestry in Benton, AR
RELATED REPORTS & OPTIONS
Farming, Fishing & Forestry
Benton
Compare Zip Codes
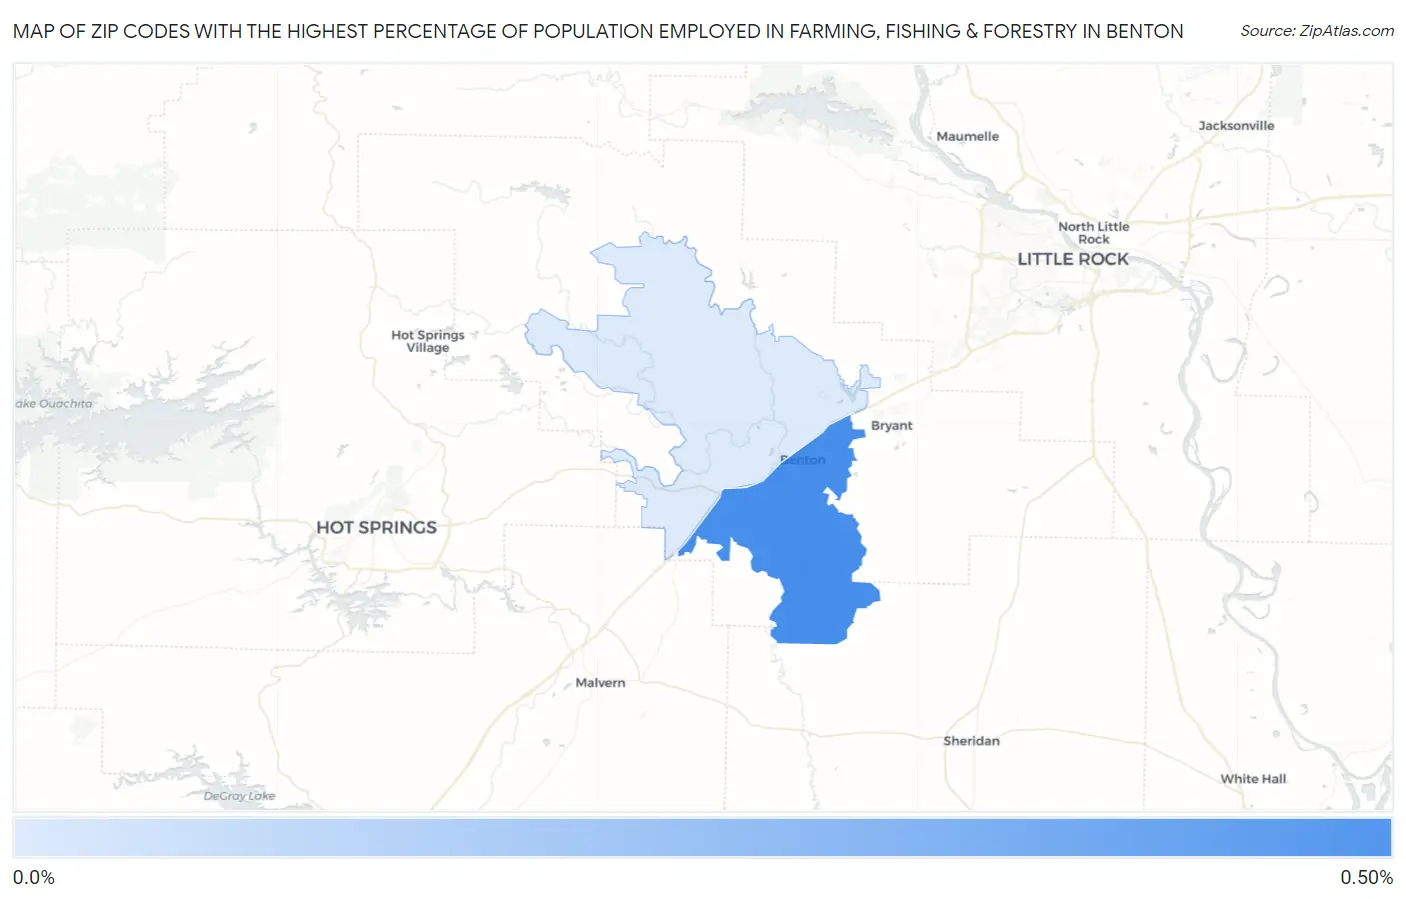
Map of Zip Codes with the Highest Percentage of Population Employed in Farming, Fishing & Forestry in Benton
0.096%
0.41%
Zip Codes with the Highest Percentage of Population Employed in Farming, Fishing & Forestry in Benton, AR
| Zip Code | % Employed | vs State | vs National | |
| 1. | 72015 | 0.41% | 0.96%(-0.544)#302 | 0.61%(-0.191)#13,638 |
| 2. | 72019 | 0.096% | 0.96%(-0.862)#342 | 0.61%(-0.510)#17,841 |
1
Common Questions
What are the Top Zip Codes with the Highest Percentage of Population Employed in Farming, Fishing & Forestry in Benton, AR?
Top Zip Codes with the Highest Percentage of Population Employed in Farming, Fishing & Forestry in Benton, AR are:
What zip code has the Highest Percentage of Population Employed in Farming, Fishing & Forestry in Benton, AR?
72015 has the Highest Percentage of Population Employed in Farming, Fishing & Forestry in Benton, AR with 0.41%.
What is the Percentage of Population Employed in Farming, Fishing & Forestry in Benton, AR?
Percentage of Population Employed in Farming, Fishing & Forestry in Benton is 0.38%.
What is the Percentage of Population Employed in Farming, Fishing & Forestry in Arkansas?
Percentage of Population Employed in Farming, Fishing & Forestry in Arkansas is 0.96%.
What is the Percentage of Population Employed in Farming, Fishing & Forestry in the United States?
Percentage of Population Employed in Farming, Fishing & Forestry in the United States is 0.61%.