Zip Codes with the Highest Percentage of Population Employed in Accommodation & Food Services in Benton, AR
RELATED REPORTS & OPTIONS
Accommodation & Food Services
Benton
Compare Zip Codes
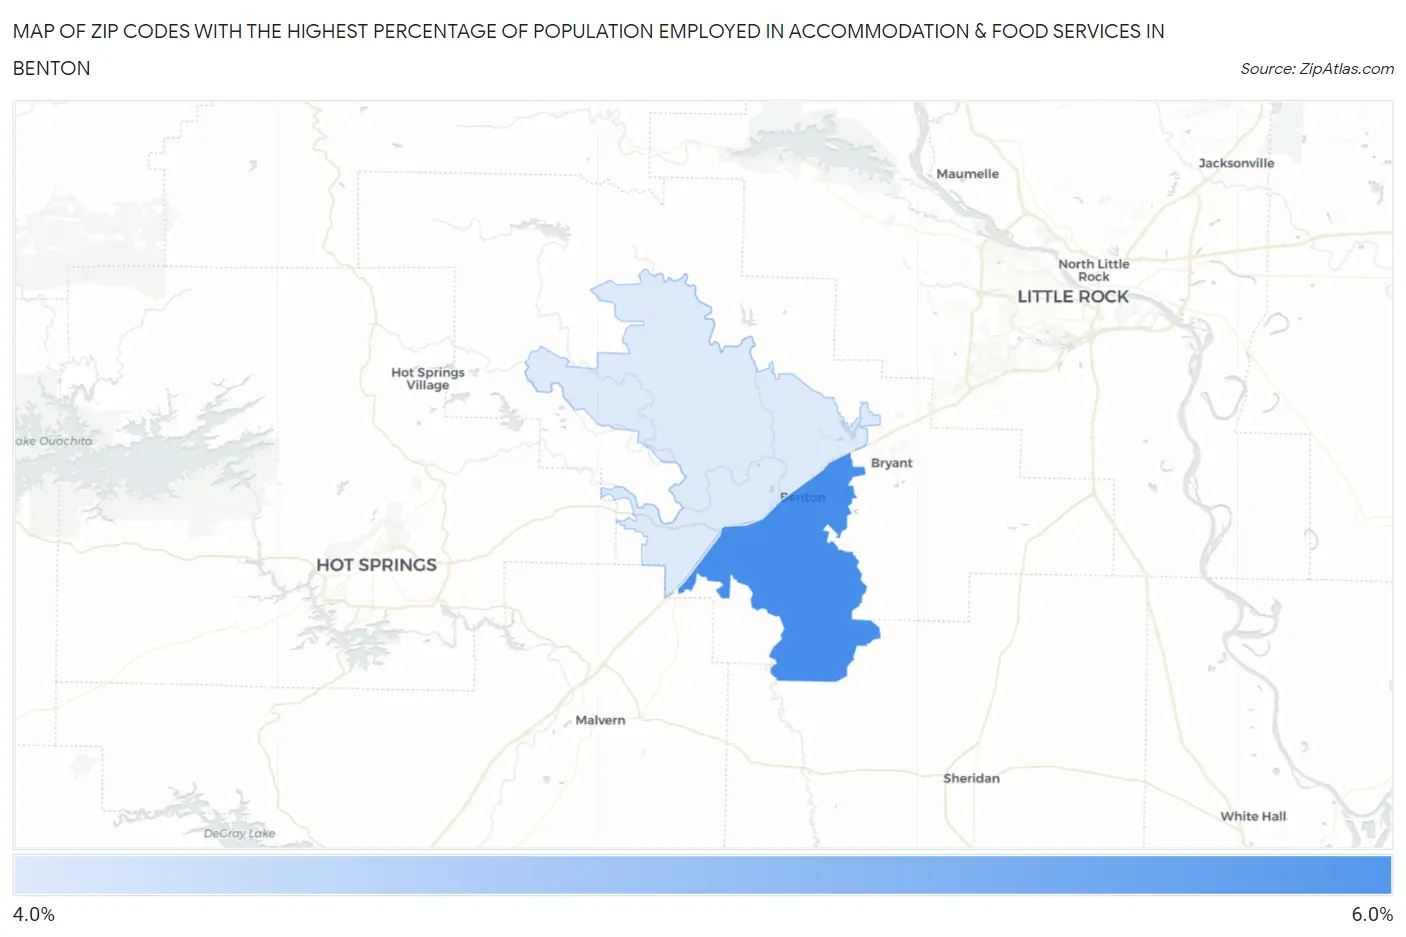
Map of Zip Codes with the Highest Percentage of Population Employed in Accommodation & Food Services in Benton
4.5%
5.5%
Zip Codes with the Highest Percentage of Population Employed in Accommodation & Food Services in Benton, AR
| Zip Code | % Employed | vs State | vs National | |
| 1. | 72015 | 5.5% | 6.6%(-1.13)#208 | 6.9%(-1.37)#15,034 |
| 2. | 72019 | 4.5% | 6.6%(-2.11)#256 | 6.9%(-2.35)#18,386 |
1
Common Questions
What are the Top Zip Codes with the Highest Percentage of Population Employed in Accommodation & Food Services in Benton, AR?
Top Zip Codes with the Highest Percentage of Population Employed in Accommodation & Food Services in Benton, AR are:
What zip code has the Highest Percentage of Population Employed in Accommodation & Food Services in Benton, AR?
72015 has the Highest Percentage of Population Employed in Accommodation & Food Services in Benton, AR with 5.5%.
What is the Percentage of Population Employed in Accommodation & Food Services in Benton, AR?
Percentage of Population Employed in Accommodation & Food Services in Benton is 5.4%.
What is the Percentage of Population Employed in Accommodation & Food Services in Arkansas?
Percentage of Population Employed in Accommodation & Food Services in Arkansas is 6.6%.
What is the Percentage of Population Employed in Accommodation & Food Services in the United States?
Percentage of Population Employed in Accommodation & Food Services in the United States is 6.9%.