Zip Codes with the Highest Percentage of Population with a Degree in Liberal Arts and History in Benton, AR
RELATED REPORTS & OPTIONS
Liberal Arts and History
Benton
Compare Zip Codes
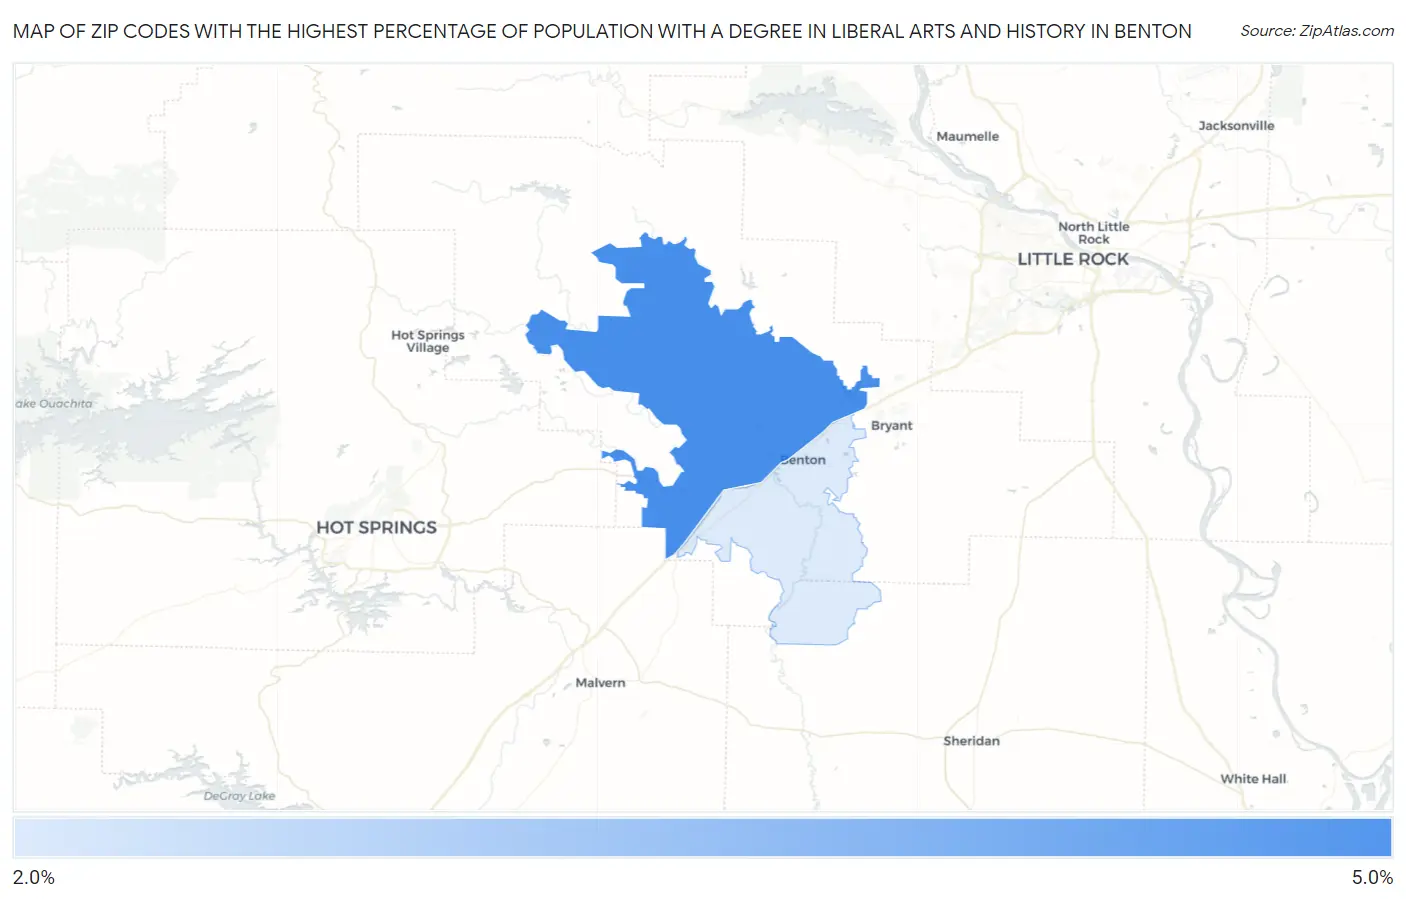
Map of Zip Codes with the Highest Percentage of Population with a Degree in Liberal Arts and History in Benton
2.8%
4.6%
Zip Codes with the Highest Percentage of Population with a Degree in Liberal Arts and History in Benton, AR
| Zip Code | % Graduates | vs State | vs National | |
| 1. | 72019 | 4.6% | 4.9%(-0.328)#188 | 4.9%(-0.299)#12,721 |
| 2. | 72015 | 2.8% | 4.9%(-2.10)#256 | 4.9%(-2.07)#19,008 |
1
Common Questions
What are the Top Zip Codes with the Highest Percentage of Population with a Degree in Liberal Arts and History in Benton, AR?
Top Zip Codes with the Highest Percentage of Population with a Degree in Liberal Arts and History in Benton, AR are:
What zip code has the Highest Percentage of Population with a Degree in Liberal Arts and History in Benton, AR?
72019 has the Highest Percentage of Population with a Degree in Liberal Arts and History in Benton, AR with 4.6%.
What is the Percentage of Population with a Degree in Liberal Arts and History in Benton, AR?
Percentage of Population with a Degree in Liberal Arts and History in Benton is 3.0%.
What is the Percentage of Population with a Degree in Liberal Arts and History in Arkansas?
Percentage of Population with a Degree in Liberal Arts and History in Arkansas is 4.9%.
What is the Percentage of Population with a Degree in Liberal Arts and History in the United States?
Percentage of Population with a Degree in Liberal Arts and History in the United States is 4.9%.