Zip Codes with the Highest Percentage of Population with a Degree in Science and Engineering in Benton, AR
RELATED REPORTS & OPTIONS
Science and Engineering
Benton
Compare Zip Codes
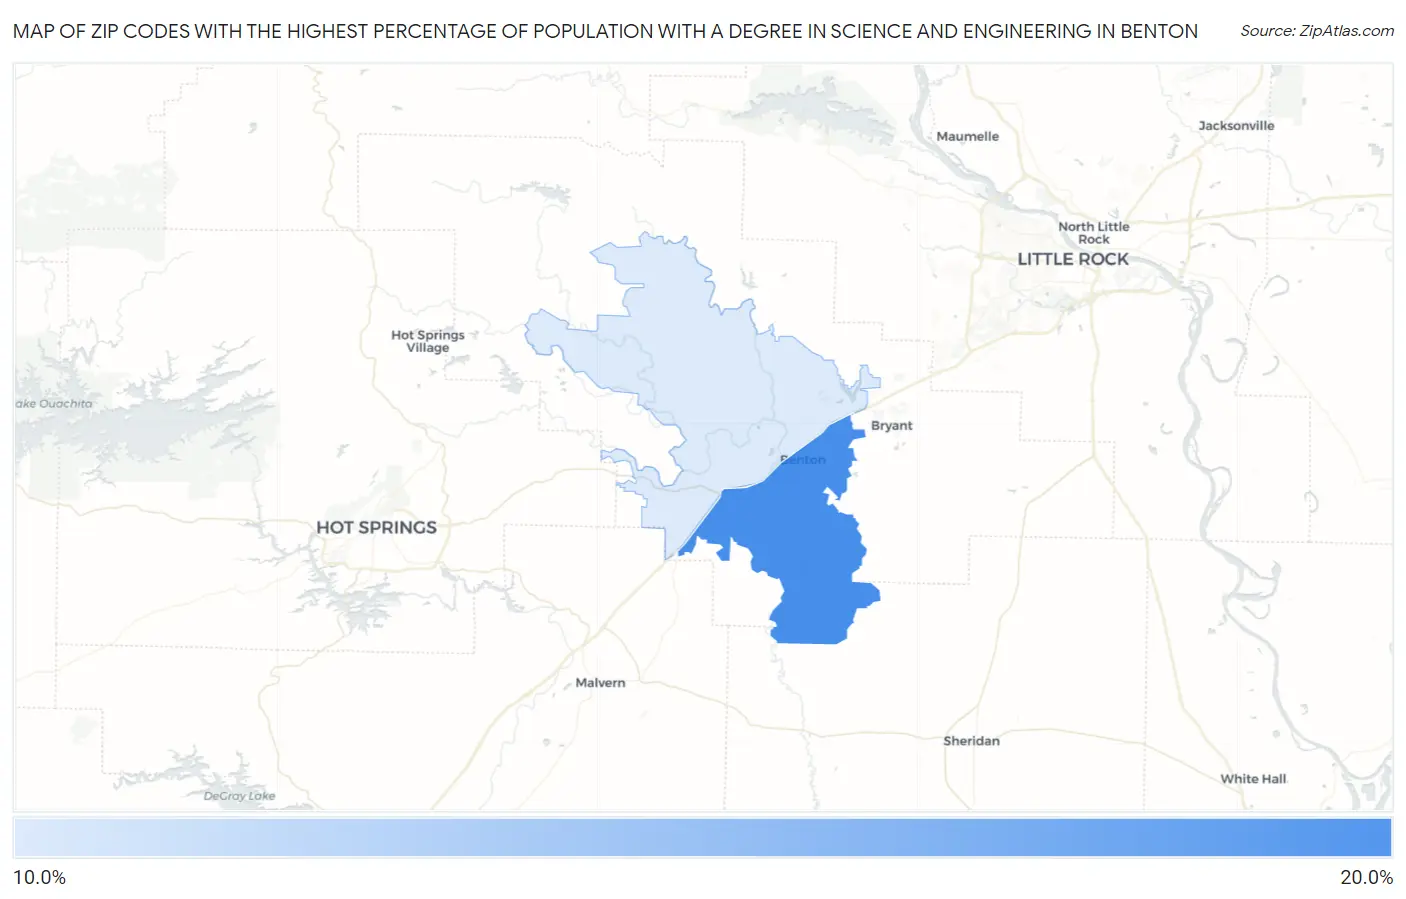
Map of Zip Codes with the Highest Percentage of Population with a Degree in Science and Engineering in Benton
16.8%
17.4%
Zip Codes with the Highest Percentage of Population with a Degree in Science and Engineering in Benton, AR
| Zip Code | % Graduates | vs State | vs National | |
| 1. | 72015 | 17.4% | 12.0%(+5.48)#117 | 9.8%(+7.66)#4,671 |
| 2. | 72019 | 16.8% | 12.0%(+4.81)#129 | 9.8%(+6.99)#5,143 |
1
Common Questions
What are the Top Zip Codes with the Highest Percentage of Population with a Degree in Science and Engineering in Benton, AR?
Top Zip Codes with the Highest Percentage of Population with a Degree in Science and Engineering in Benton, AR are:
What zip code has the Highest Percentage of Population with a Degree in Science and Engineering in Benton, AR?
72015 has the Highest Percentage of Population with a Degree in Science and Engineering in Benton, AR with 17.4%.
What is the Percentage of Population with a Degree in Science and Engineering in Benton, AR?
Percentage of Population with a Degree in Science and Engineering in Benton is 18.6%.
What is the Percentage of Population with a Degree in Science and Engineering in Arkansas?
Percentage of Population with a Degree in Science and Engineering in Arkansas is 12.0%.
What is the Percentage of Population with a Degree in Science and Engineering in the United States?
Percentage of Population with a Degree in Science and Engineering in the United States is 9.8%.