Zip Codes with the Highest Percentage of Population Employed in Architecture & Engineering in Parkersburg, WV
RELATED REPORTS & OPTIONS
Architecture & Engineering
Parkersburg
Compare Zip Codes
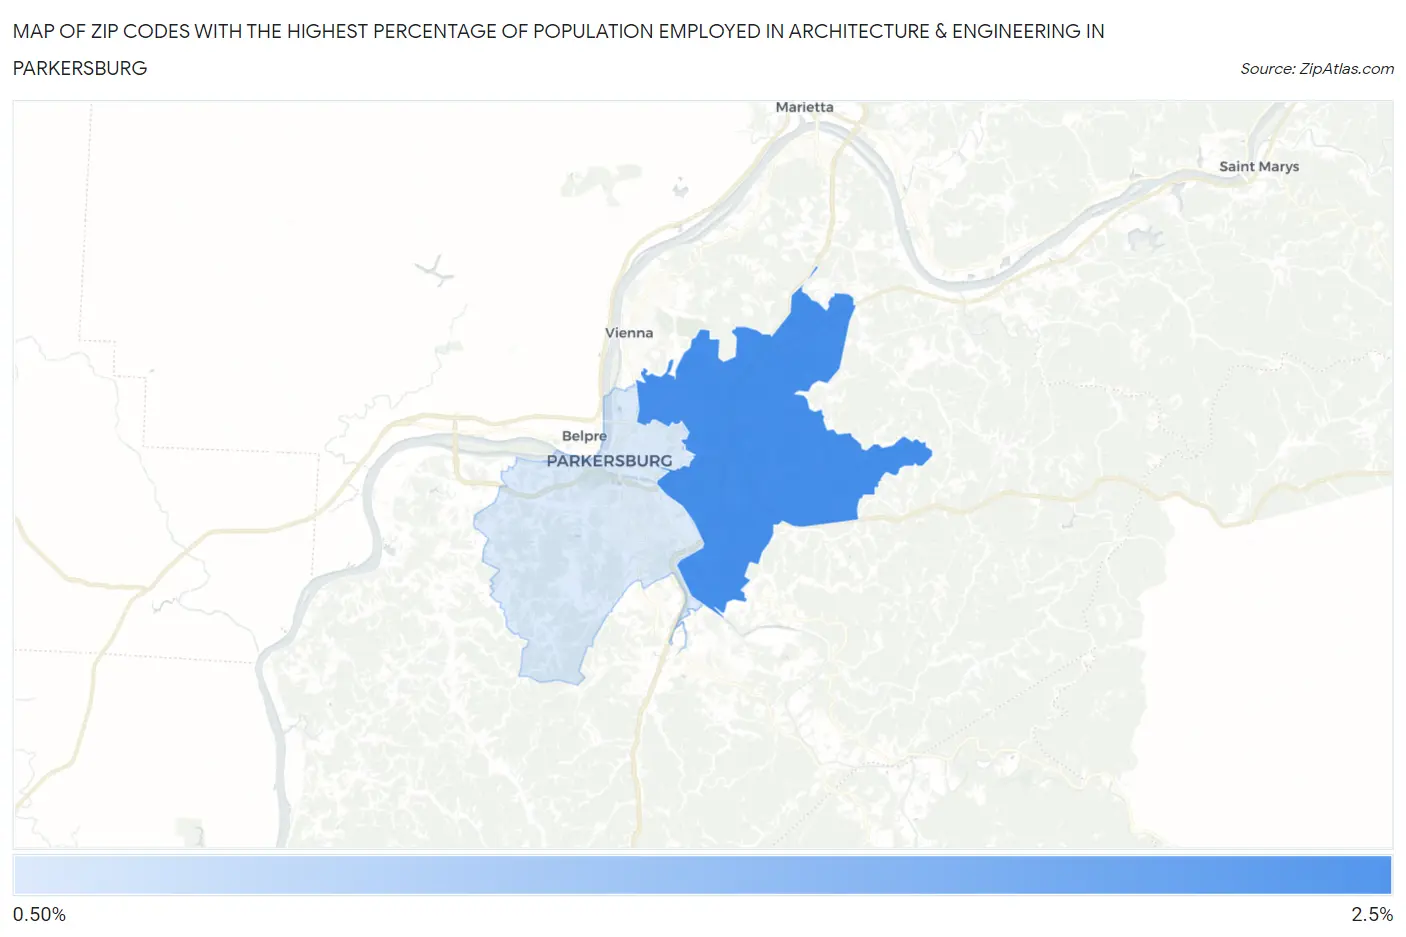
Map of Zip Codes with the Highest Percentage of Population Employed in Architecture & Engineering in Parkersburg
0.89%
2.4%
Zip Codes with the Highest Percentage of Population Employed in Architecture & Engineering in Parkersburg, WV
| Zip Code | % Employed | vs State | vs National | |
| 1. | 26104 | 2.4% | 1.6%(+0.833)#102 | 2.1%(+0.243)#7,504 |
| 2. | 26101 | 0.89% | 1.6%(-0.665)#180 | 2.1%(-1.25)#17,416 |
1
Common Questions
What are the Top Zip Codes with the Highest Percentage of Population Employed in Architecture & Engineering in Parkersburg, WV?
Top Zip Codes with the Highest Percentage of Population Employed in Architecture & Engineering in Parkersburg, WV are:
What zip code has the Highest Percentage of Population Employed in Architecture & Engineering in Parkersburg, WV?
26104 has the Highest Percentage of Population Employed in Architecture & Engineering in Parkersburg, WV with 2.4%.
What is the Percentage of Population Employed in Architecture & Engineering in Parkersburg, WV?
Percentage of Population Employed in Architecture & Engineering in Parkersburg is 0.88%.
What is the Percentage of Population Employed in Architecture & Engineering in West Virginia?
Percentage of Population Employed in Architecture & Engineering in West Virginia is 1.6%.
What is the Percentage of Population Employed in Architecture & Engineering in the United States?
Percentage of Population Employed in Architecture & Engineering in the United States is 2.1%.