Zip Codes with the Highest Percentage of Population Employed in Food Preparation & Serving in Parkersburg, WV
RELATED REPORTS & OPTIONS
Food Preparation & Serving
Parkersburg
Compare Zip Codes
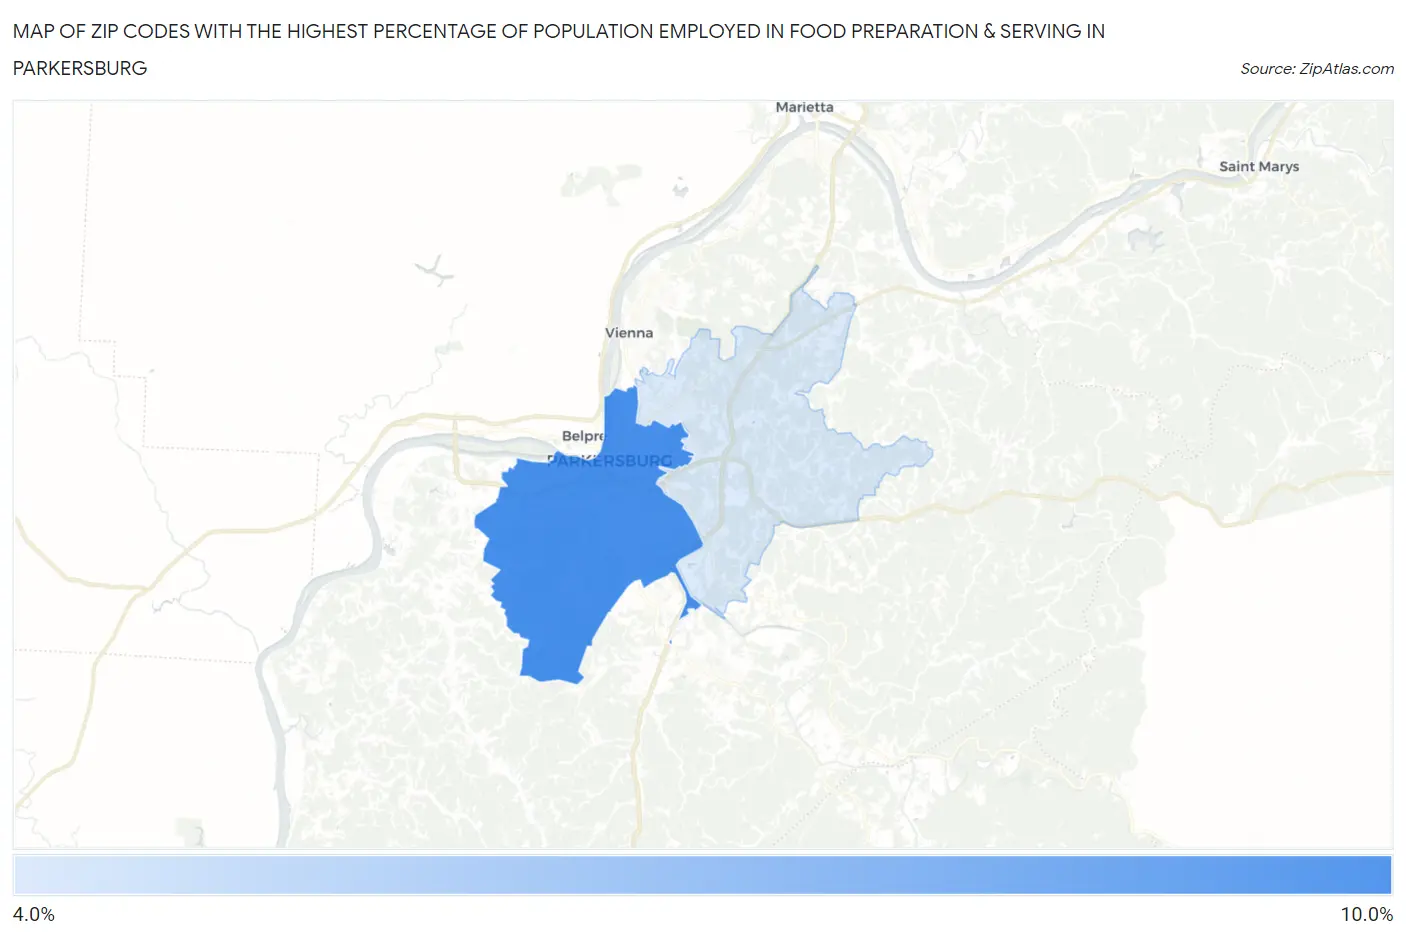
Map of Zip Codes with the Highest Percentage of Population Employed in Food Preparation & Serving in Parkersburg
4.2%
9.9%
Zip Codes with the Highest Percentage of Population Employed in Food Preparation & Serving in Parkersburg, WV
| Zip Code | % Employed | vs State | vs National | |
| 1. | 26101 | 9.9% | 5.7%(+4.23)#99 | 5.3%(+4.61)#2,716 |
| 2. | 26104 | 4.2% | 5.7%(-1.48)#261 | 5.3%(-1.11)#16,405 |
1
Common Questions
What are the Top Zip Codes with the Highest Percentage of Population Employed in Food Preparation & Serving in Parkersburg, WV?
Top Zip Codes with the Highest Percentage of Population Employed in Food Preparation & Serving in Parkersburg, WV are:
What zip code has the Highest Percentage of Population Employed in Food Preparation & Serving in Parkersburg, WV?
26101 has the Highest Percentage of Population Employed in Food Preparation & Serving in Parkersburg, WV with 9.9%.
What is the Percentage of Population Employed in Food Preparation & Serving in Parkersburg, WV?
Percentage of Population Employed in Food Preparation & Serving in Parkersburg is 6.9%.
What is the Percentage of Population Employed in Food Preparation & Serving in West Virginia?
Percentage of Population Employed in Food Preparation & Serving in West Virginia is 5.7%.
What is the Percentage of Population Employed in Food Preparation & Serving in the United States?
Percentage of Population Employed in Food Preparation & Serving in the United States is 5.3%.