Zip Codes with the Highest Percentage of Population Employed in Security & Protection in Parkersburg, WV
RELATED REPORTS & OPTIONS
Security & Protection
Parkersburg
Compare Zip Codes
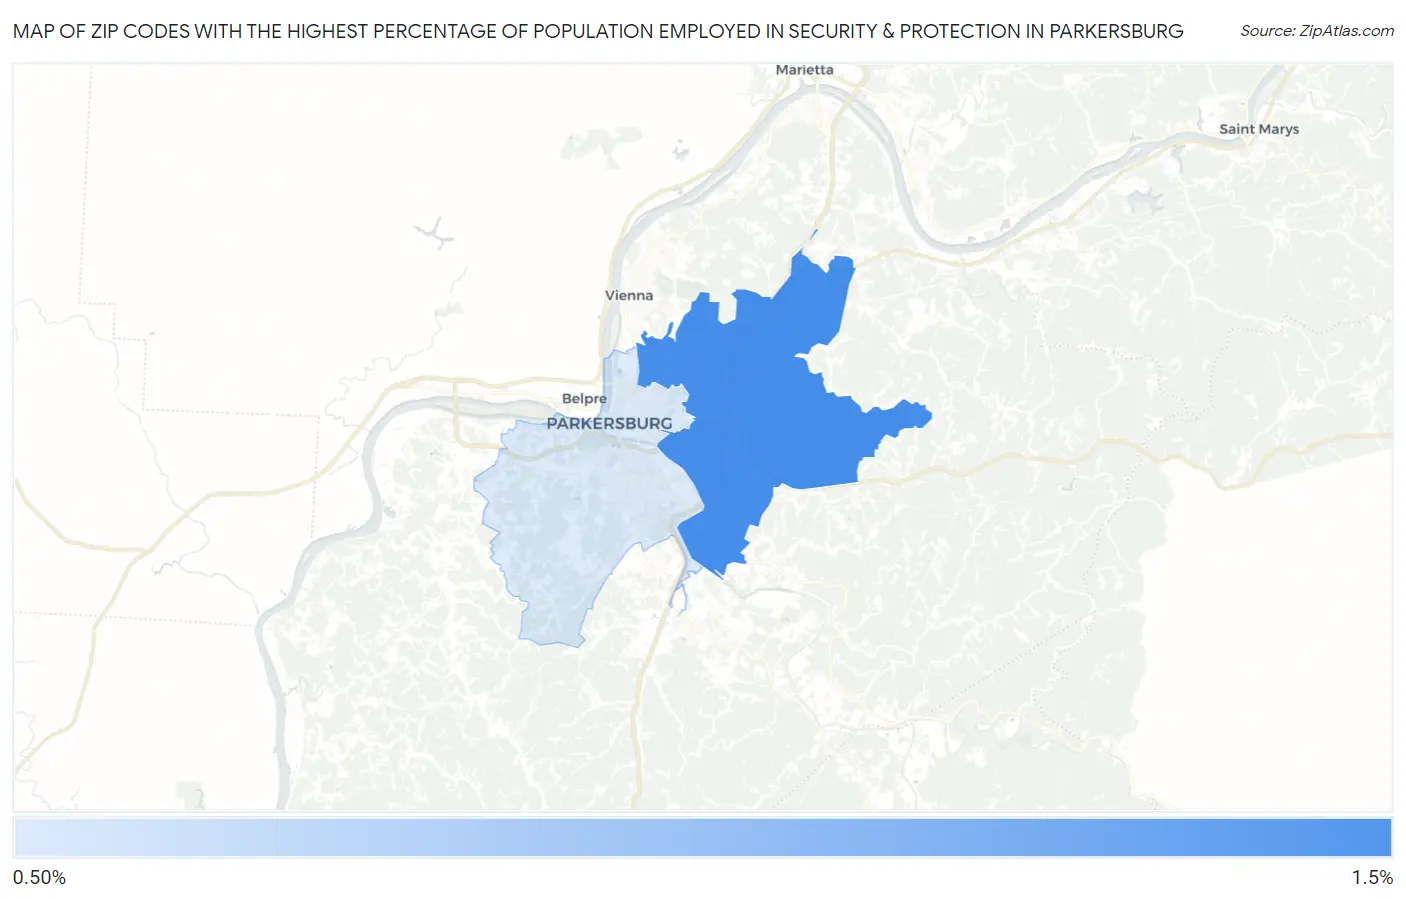
Map of Zip Codes with the Highest Percentage of Population Employed in Security & Protection in Parkersburg
1.4%
1.5%
Zip Codes with the Highest Percentage of Population Employed in Security & Protection in Parkersburg, WV
| Zip Code | % Employed | vs State | vs National | |
| 1. | 26104 | 1.5% | 2.4%(-0.948)#261 | 2.1%(-0.671)#16,368 |
| 2. | 26101 | 1.4% | 2.4%(-1.01)#268 | 2.1%(-0.733)#16,834 |
1
Common Questions
What are the Top Zip Codes with the Highest Percentage of Population Employed in Security & Protection in Parkersburg, WV?
Top Zip Codes with the Highest Percentage of Population Employed in Security & Protection in Parkersburg, WV are:
What zip code has the Highest Percentage of Population Employed in Security & Protection in Parkersburg, WV?
26104 has the Highest Percentage of Population Employed in Security & Protection in Parkersburg, WV with 1.5%.
What is the Percentage of Population Employed in Security & Protection in Parkersburg, WV?
Percentage of Population Employed in Security & Protection in Parkersburg is 1.2%.
What is the Percentage of Population Employed in Security & Protection in West Virginia?
Percentage of Population Employed in Security & Protection in West Virginia is 2.4%.
What is the Percentage of Population Employed in Security & Protection in the United States?
Percentage of Population Employed in Security & Protection in the United States is 2.1%.