Zip Codes with the Highest Percentage of Population Employed in Architecture & Engineering in Huntington, WV
RELATED REPORTS & OPTIONS
Architecture & Engineering
Huntington
Compare Zip Codes
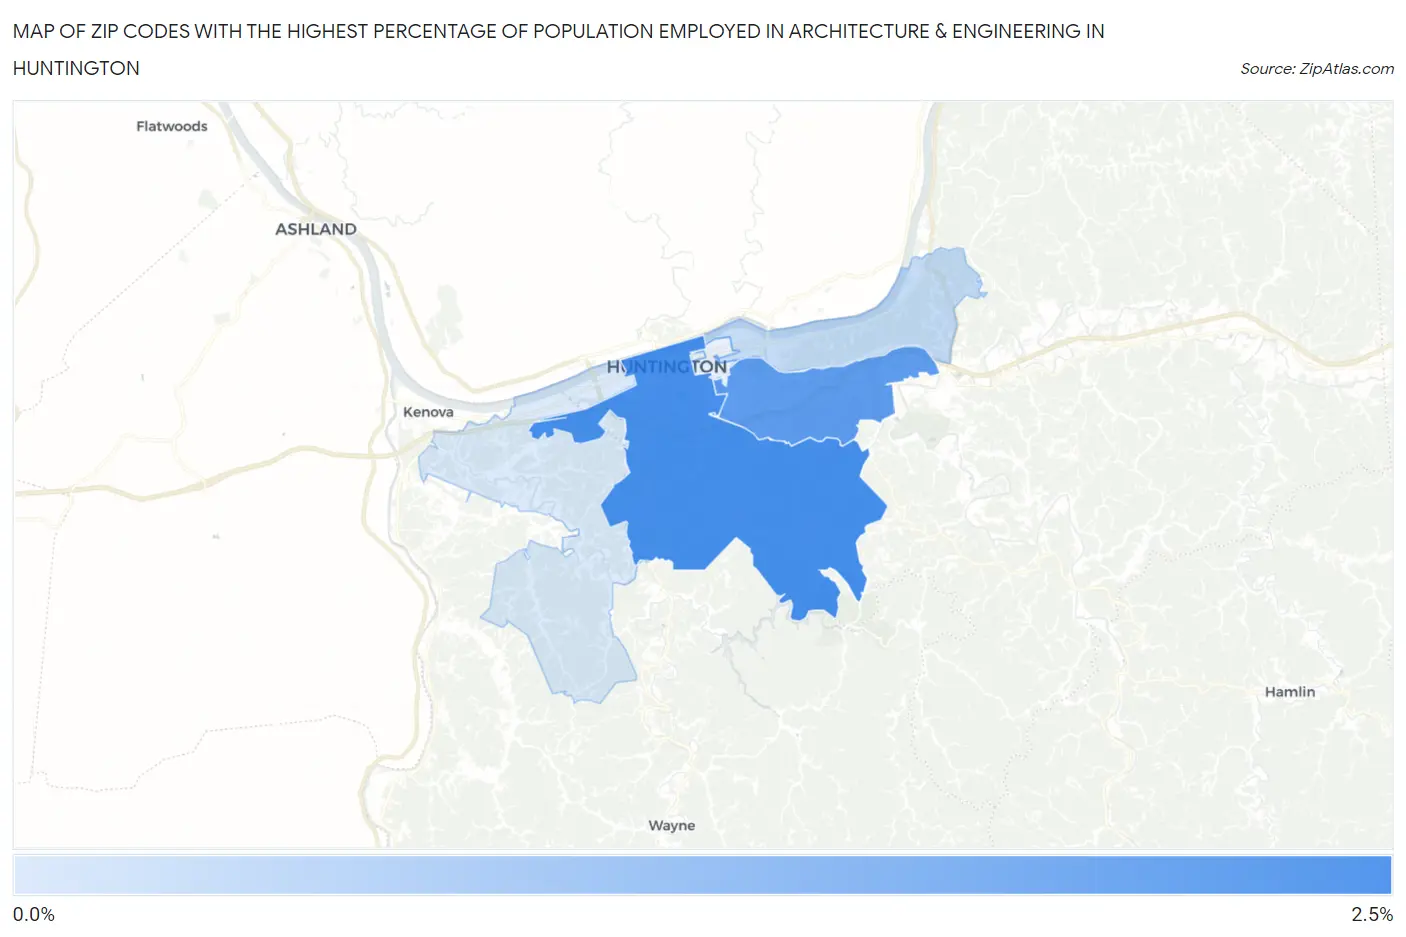
Map of Zip Codes with the Highest Percentage of Population Employed in Architecture & Engineering in Huntington
0.26%
2.2%
Zip Codes with the Highest Percentage of Population Employed in Architecture & Engineering in Huntington, WV
| Zip Code | % Employed | vs State | vs National | |
| 1. | 25701 | 2.2% | 1.6%(+0.661)#113 | 2.1%(+0.072)#8,373 |
| 2. | 25705 | 1.9% | 1.6%(+0.347)#128 | 2.1%(-0.243)#10,196 |
| 3. | 25702 | 0.56% | 1.6%(-0.995)#207 | 2.1%(-1.58)#19,877 |
| 4. | 25704 | 0.26% | 1.6%(-1.30)#226 | 2.1%(-1.89)#21,794 |
1
Common Questions
What are the Top 5 Zip Codes with the Highest Percentage of Population Employed in Architecture & Engineering in Huntington, WV?
Top 5 Zip Codes with the Highest Percentage of Population Employed in Architecture & Engineering in Huntington, WV are:
What zip code has the Highest Percentage of Population Employed in Architecture & Engineering in Huntington, WV?
25701 has the Highest Percentage of Population Employed in Architecture & Engineering in Huntington, WV with 2.2%.
What is the Percentage of Population Employed in Architecture & Engineering in Huntington, WV?
Percentage of Population Employed in Architecture & Engineering in Huntington is 1.3%.
What is the Percentage of Population Employed in Architecture & Engineering in West Virginia?
Percentage of Population Employed in Architecture & Engineering in West Virginia is 1.6%.
What is the Percentage of Population Employed in Architecture & Engineering in the United States?
Percentage of Population Employed in Architecture & Engineering in the United States is 2.1%.