Zip Codes with the Highest Percentage of Immigrants from Asia in Huntington, WV
RELATED REPORTS & OPTIONS
Asia
Huntington
Compare Zip Codes
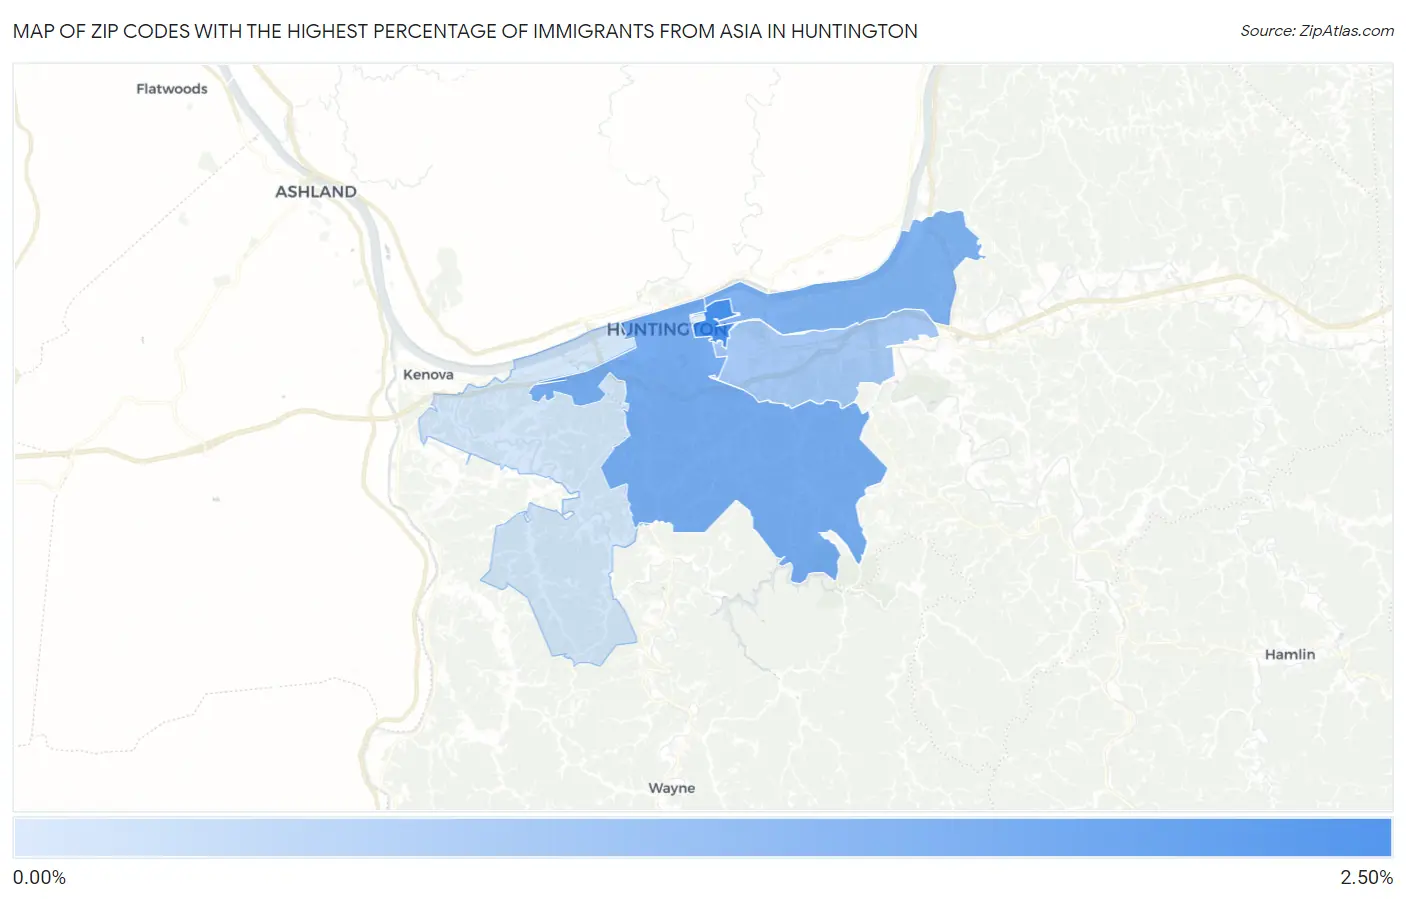
Map of Zip Codes with the Highest Percentage of Immigrants from Asia in Huntington
0.095%
2.19%
Zip Codes with the Highest Percentage of Immigrants from Asia in Huntington, WV
| Zip Code | Asia | vs State | vs National | |
| 1. | 25703 | 2.19% | 0.65%(+1.54)#17 | 4.26%(-2.07)#6,340 |
| 2. | 25701 | 1.48% | 0.65%(+0.833)#31 | 4.26%(-2.78)#8,337 |
| 3. | 25702 | 1.34% | 0.65%(+0.687)#34 | 4.26%(-2.92)#8,829 |
| 4. | 25705 | 0.80% | 0.65%(+0.151)#58 | 4.26%(-3.46)#11,506 |
| 5. | 25704 | 0.095% | 0.65%(-0.554)#133 | 4.26%(-4.17)#18,459 |
1
Common Questions
What are the Top 5 Zip Codes with the Highest Percentage of Immigrants from Asia in Huntington, WV?
Top 5 Zip Codes with the Highest Percentage of Immigrants from Asia in Huntington, WV are:
What zip code has the Highest Percentage of Immigrants from Asia in Huntington, WV?
25703 has the Highest Percentage of Immigrants from Asia in Huntington, WV with 2.19%.
What is the Percentage of Immigrants from Asia in Huntington, WV?
Percentage of Immigrants from Asia in Huntington is 1.24%.
What is the Percentage of Immigrants from Asia in West Virginia?
Percentage of Immigrants from Asia in West Virginia is 0.65%.
What is the Percentage of Immigrants from Asia in the United States?
Percentage of Immigrants from Asia in the United States is 4.26%.