Zip Codes with the Highest Percentage of Immigrants from Eastern Asia in Huntington, WV
RELATED REPORTS & OPTIONS
Eastern Asia
Huntington
Compare Zip Codes
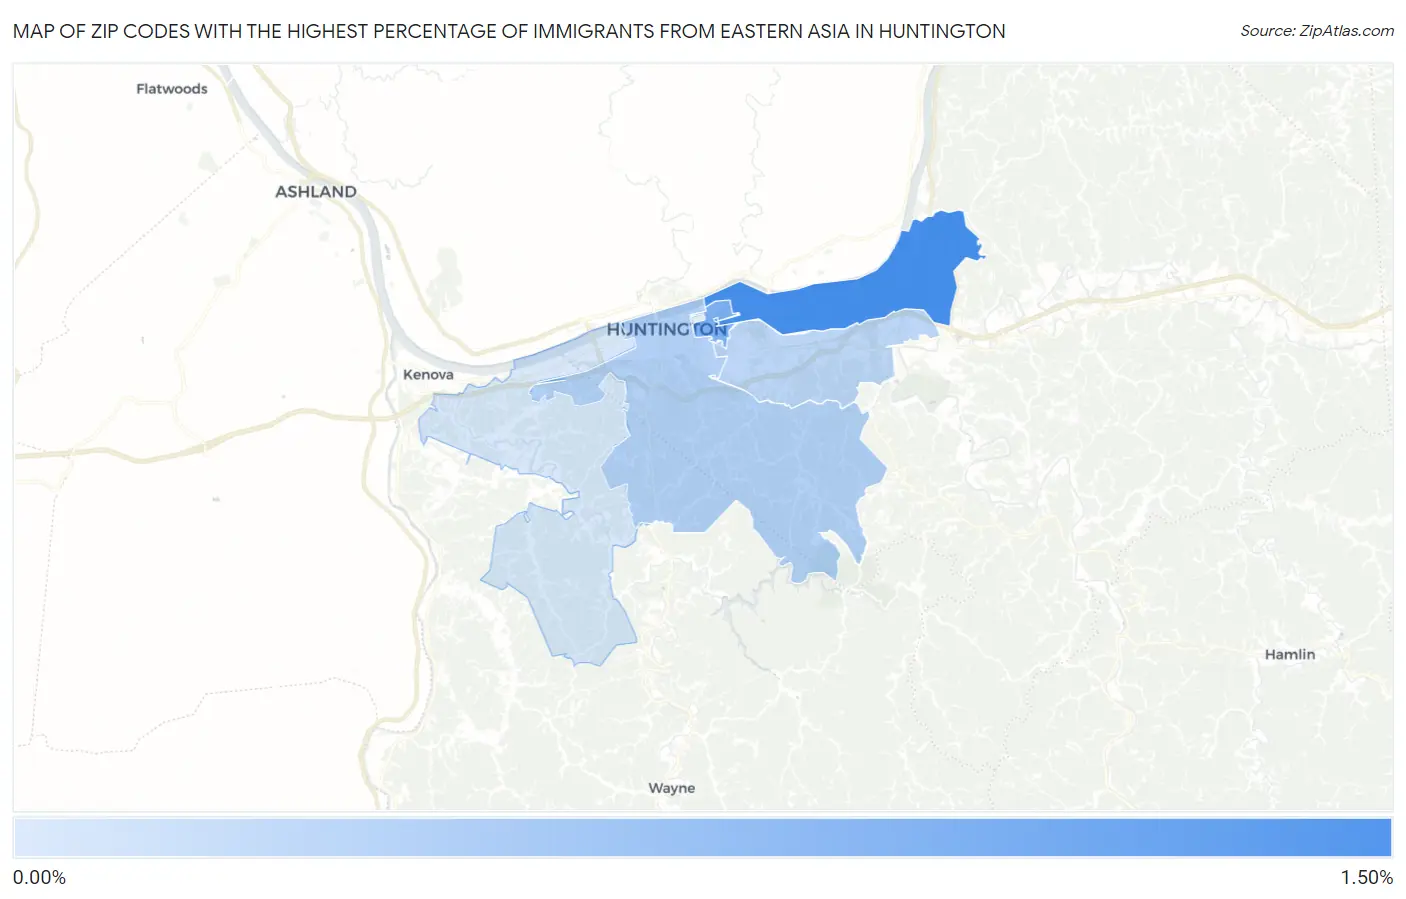
Map of Zip Codes with the Highest Percentage of Immigrants from Eastern Asia in Huntington
0.034%
1.15%
Zip Codes with the Highest Percentage of Immigrants from Eastern Asia in Huntington, WV
| Zip Code | Eastern Asia | vs State | vs National | |
| 1. | 25702 | 1.15% | 0.18%(+0.969)#8 | 1.28%(-0.122)#3,421 |
| 2. | 25703 | 0.75% | 0.18%(+0.566)#18 | 1.28%(-0.525)#4,955 |
| 3. | 25701 | 0.31% | 0.18%(+0.127)#34 | 1.28%(-0.965)#8,616 |
| 4. | 25705 | 0.24% | 0.18%(+0.058)#41 | 1.28%(-1.03)#9,592 |
| 5. | 25704 | 0.034% | 0.18%(-0.150)#83 | 1.28%(-1.24)#13,598 |
1
Common Questions
What are the Top 5 Zip Codes with the Highest Percentage of Immigrants from Eastern Asia in Huntington, WV?
Top 5 Zip Codes with the Highest Percentage of Immigrants from Eastern Asia in Huntington, WV are:
What zip code has the Highest Percentage of Immigrants from Eastern Asia in Huntington, WV?
25702 has the Highest Percentage of Immigrants from Eastern Asia in Huntington, WV with 1.15%.
What is the Percentage of Immigrants from Eastern Asia in Huntington, WV?
Percentage of Immigrants from Eastern Asia in Huntington is 0.45%.
What is the Percentage of Immigrants from Eastern Asia in West Virginia?
Percentage of Immigrants from Eastern Asia in West Virginia is 0.18%.
What is the Percentage of Immigrants from Eastern Asia in the United States?
Percentage of Immigrants from Eastern Asia in the United States is 1.28%.