Yakama vs Ugandan No Vehicles in Household
COMPARE
Yakama
Ugandan
No Vehicles in Household
No Vehicles in Household Comparison
Yakama
Ugandans
6.6%
NO VEHICLES IN HOUSEHOLD
100.0/ 100
METRIC RATING
5th/ 347
METRIC RANK
11.4%
NO VEHICLES IN HOUSEHOLD
5.3/ 100
METRIC RATING
229th/ 347
METRIC RANK
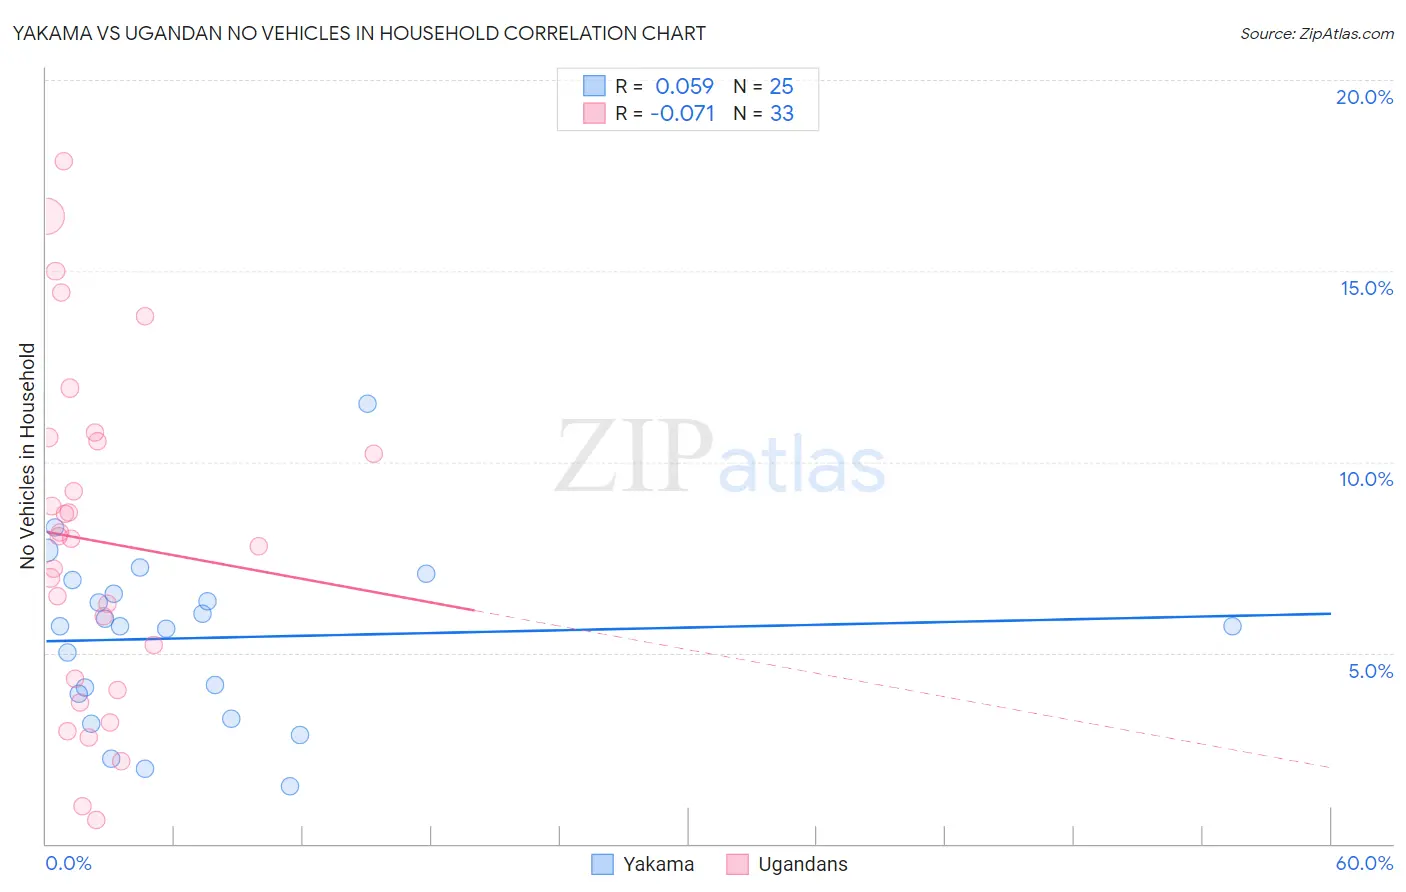
Yakama vs Ugandan No Vehicles in Household Correlation Chart
The statistical analysis conducted on geographies consisting of 19,905,065 people shows a slight positive correlation between the proportion of Yakama and percentage of households with no vehicle available in the United States with a correlation coefficient (R) of 0.059 and weighted average of 6.6%. Similarly, the statistical analysis conducted on geographies consisting of 93,973,141 people shows a slight negative correlation between the proportion of Ugandans and percentage of households with no vehicle available in the United States with a correlation coefficient (R) of -0.071 and weighted average of 11.4%, a difference of 72.8%.
No Vehicles in Household Correlation Summary
| Measurement | Yakama | Ugandan |
| Minimum | 1.5% | 0.63% |
| Maximum | 11.5% | 17.9% |
| Range | 10.0% | 17.2% |
| Mean | 5.4% | 7.9% |
| Median | 5.7% | 8.0% |
| Interquartile 25% (IQ1) | 3.6% | 4.2% |
| Interquartile 75% (IQ3) | 6.7% | 10.6% |
| Interquartile Range (IQR) | 3.1% | 6.4% |
| Standard Deviation (Sample) | 2.3% | 4.4% |
| Standard Deviation (Population) | 2.2% | 4.3% |
Similar Demographics by No Vehicles in Household
Demographics Similar to Yakama by No Vehicles in Household
In terms of no vehicles in household, the demographic groups most similar to Yakama are Danish (6.6%, a difference of 0.35%), German (6.7%, a difference of 0.99%), English (6.5%, a difference of 1.6%), Scottish (6.8%, a difference of 2.3%), and Norwegian (6.4%, a difference of 2.7%).
| Demographics | Rating | Rank | No Vehicles in Household |
| Luxembourgers | 100.0 /100 | #1 | Exceptional 5.4% |
| Norwegians | 100.0 /100 | #2 | Exceptional 6.4% |
| English | 100.0 /100 | #3 | Exceptional 6.5% |
| Danes | 100.0 /100 | #4 | Exceptional 6.6% |
| Yakama | 100.0 /100 | #5 | Exceptional 6.6% |
| Germans | 100.0 /100 | #6 | Exceptional 6.7% |
| Scottish | 100.0 /100 | #7 | Exceptional 6.8% |
| Swedes | 100.0 /100 | #8 | Exceptional 6.8% |
| Scotch-Irish | 100.0 /100 | #9 | Exceptional 6.8% |
| Dutch | 100.0 /100 | #10 | Exceptional 6.8% |
| Czechs | 100.0 /100 | #11 | Exceptional 6.9% |
| Assyrians/Chaldeans/Syriacs | 100.0 /100 | #12 | Exceptional 7.0% |
| Scandinavians | 100.0 /100 | #13 | Exceptional 7.0% |
| Mexicans | 100.0 /100 | #14 | Exceptional 7.0% |
| Whites/Caucasians | 100.0 /100 | #15 | Exceptional 7.0% |
Demographics Similar to Ugandans by No Vehicles in Household
In terms of no vehicles in household, the demographic groups most similar to Ugandans are Immigrants from Romania (11.4%, a difference of 0.040%), Immigrants from Pakistan (11.4%, a difference of 0.080%), Immigrants from Somalia (11.4%, a difference of 0.10%), Immigrants from Norway (11.4%, a difference of 0.13%), and Immigrants from Japan (11.4%, a difference of 0.13%).
| Demographics | Rating | Rank | No Vehicles in Household |
| Immigrants | South America | 8.0 /100 | #222 | Tragic 11.3% |
| Uruguayans | 7.7 /100 | #223 | Tragic 11.3% |
| Immigrants | Hong Kong | 7.2 /100 | #224 | Tragic 11.3% |
| Immigrants | Sierra Leone | 6.4 /100 | #225 | Tragic 11.3% |
| Immigrants | Somalia | 5.4 /100 | #226 | Tragic 11.4% |
| Immigrants | Pakistan | 5.4 /100 | #227 | Tragic 11.4% |
| Immigrants | Romania | 5.3 /100 | #228 | Tragic 11.4% |
| Ugandans | 5.3 /100 | #229 | Tragic 11.4% |
| Immigrants | Norway | 5.1 /100 | #230 | Tragic 11.4% |
| Immigrants | Japan | 5.1 /100 | #231 | Tragic 11.4% |
| Immigrants | Turkey | 4.8 /100 | #232 | Tragic 11.5% |
| Houma | 4.7 /100 | #233 | Tragic 11.5% |
| Immigrants | Peru | 4.5 /100 | #234 | Tragic 11.5% |
| Kiowa | 4.0 /100 | #235 | Tragic 11.5% |
| Cree | 3.5 /100 | #236 | Tragic 11.6% |